The following media items used in this module are protected by the details of their copyrights. Please use the "copyright terms" link associated with each media item below for more information.
Click an image to view it at full size in a new browser window/tab.
|
|
|
credits:
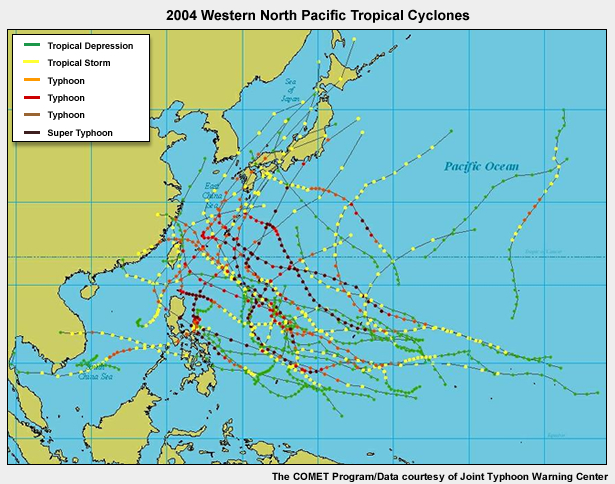
The COMET Program/Data courtesy of Joint Typhoon Warning Center
copyright terms:
COMET Standard Terms of Use
description:
Hurricane tracks for 2004 in western North Pacific
|
credits:
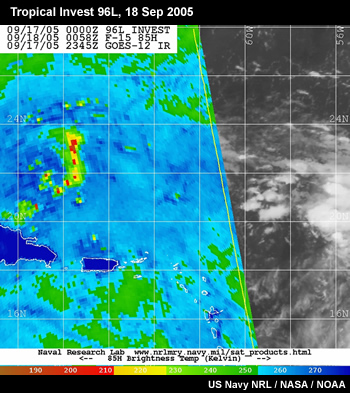
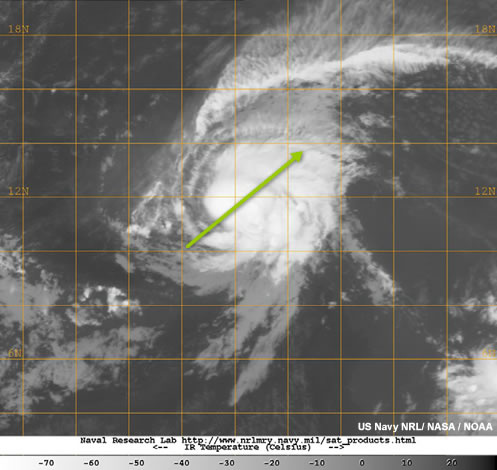
US Navy NRL/ NASA / NOAA
copyright terms:
COMET Standard Terms of Use
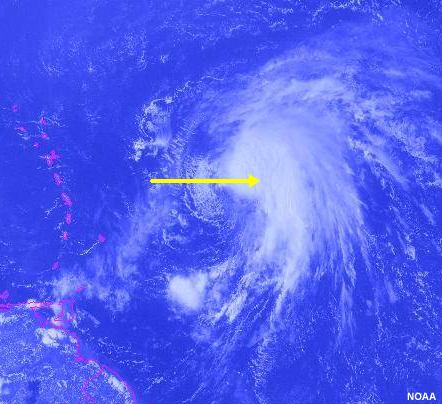
description:
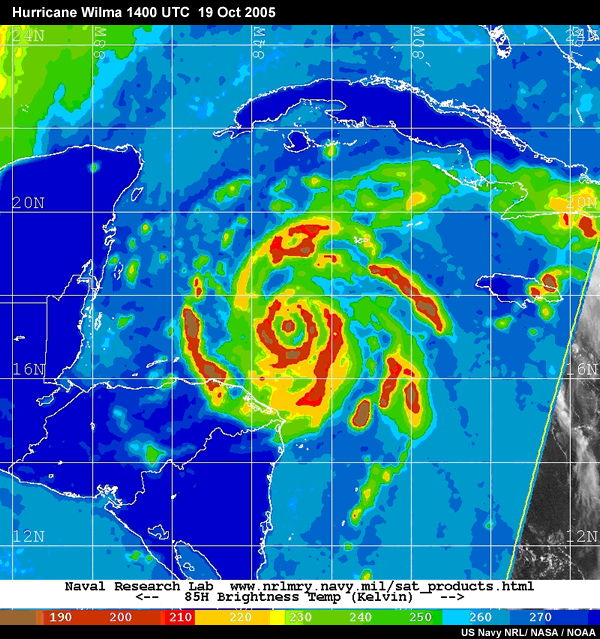
Combined infrared and SSM/I satellite image for Tropical Invest 96L, the disturbance that became Hurricane Rita (2005). Images are taken near 0000UTC 18 Sep 2005. Note the ?hook? of intense convection near the western edge of the image. The peak surface winds associated with this disturbance were estimated to be 12 m s-1 with minimum surface pressure of 1012 hPa.
|

credits:
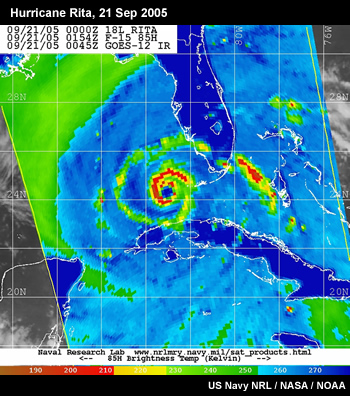
US Navy NRL/ NASA / NOAA
copyright terms:
COMET Standard Terms of Use
description:
Combined infrared and SSM/I satellite images of Tropical Storm Rita. Images are taken near 0000 UTC 20 Sep 2005 when Rita had central pressure of 993 hPa and peak winds of 30 m s-1.
|
credits:
US Navy NRL/ NASA / NOAA
copyright terms:
COMET Standard Terms of Use
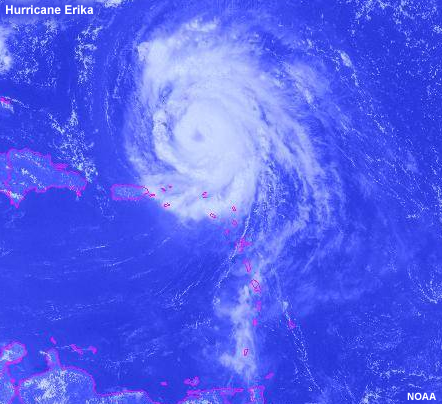
description:
Combined infrared and SSM/I satellite images of Hurricane Rita. Images are taken near 0000UTC 21 Sep 2005. At this time, Rita had peak winds of 45 m s-1 and central pressure of 967 hPa, making it a Category 2 on the Saffir-Simpson scale. Note the intense eyewall convection and clear eye.
|
credits:
US Navy NRL/ NASA / NOAA
copyright terms:
COMET Standard Terms of Use
description:
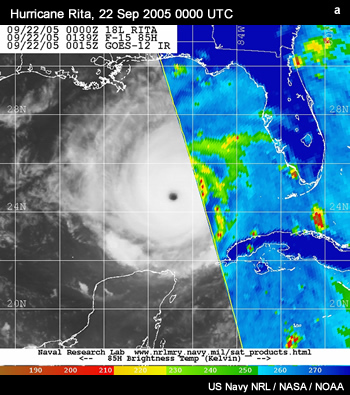
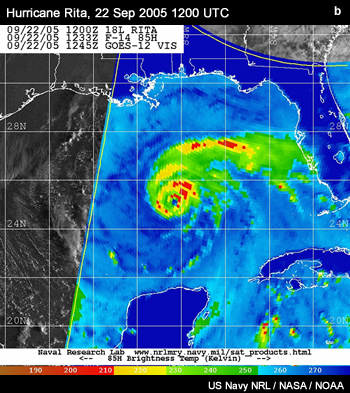
Combined infrared and SSM/I satellite images of Hurricane Rita at about 0000UTC 22 Sep 2005
|
credits:
US Navy NRL/ NASA / NOAA
copyright terms:
COMET Standard Terms of Use
description:
Combined infrared and SSM/I satellite images of Hurricane Rita at about 0000UTC 22 Sep 2005
|
credits:
US Navy NRL/ NASA / NOAA
copyright terms:
COMET Standard Terms of Use
description:
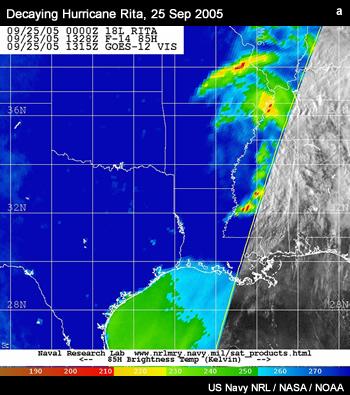
Combined infrared and SSM/I satellite images of the decaying Hurricane Rita between 1200 UTC 25 Sep
|
credits:
US Navy NRL/ NASA / NOAA
copyright terms:
COMET Standard Terms of Use
description:
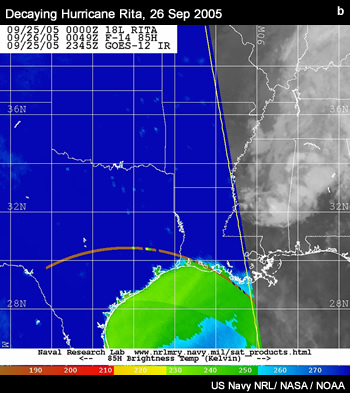
Combined infrared and SSM/I satellite images of the decaying Hurricane Rita between 1200 UTC 26 Sep
|
|
credits:
The COMET Program/Data courtesy of Joint Typhoon Warning Center
copyright terms:
COMET Standard Terms of Use
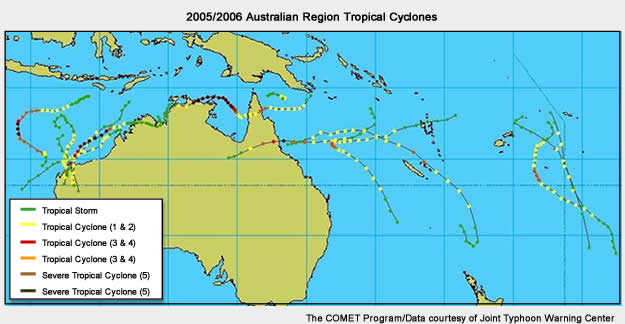
description:
Hurricane tracks for 2006 in Australian Region
|
|
|
credits:
US Navy/NRL/Eumetsat 2007
copyright terms:
COMET Standard Terms of Use
description:
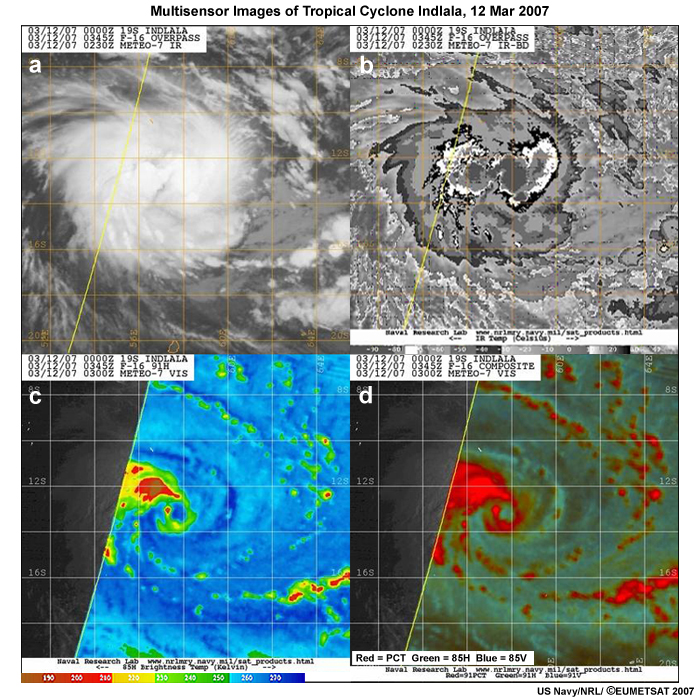
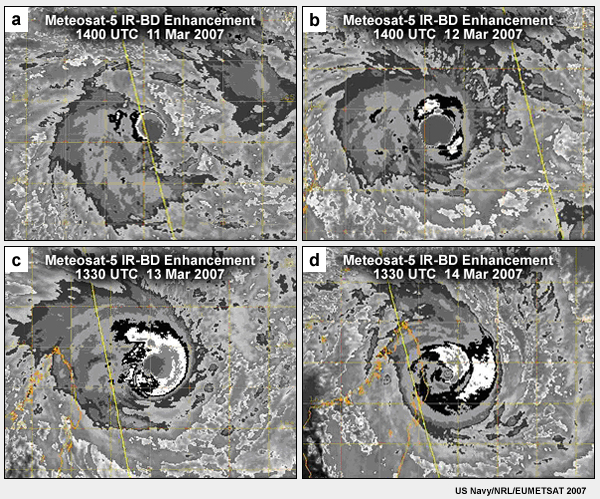
Tropical Cyclone Indlala observed by geostationary grayscale IR and enhanced IR-BD (a, b) and polar-orbiting microwave 85GHz sensor (c, d).
|
credits:
The COMET Program/Data courtesy of Joint Typhoon Warning Center
copyright terms:
COMET Standard Terms of Use
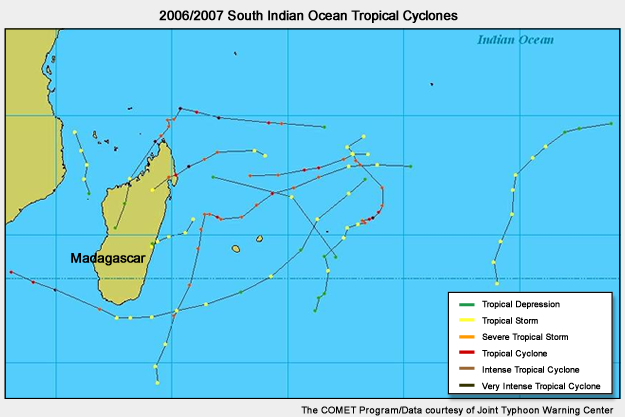
description:
Hurricane tracks for 2007 in SW Indian Ocean
|
credits:
Bosart and Carr 1978
copyright terms:
COMET Standard Terms of Use
description:
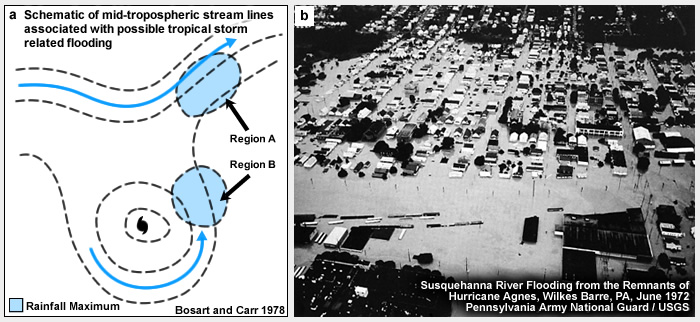
Interactions of Agnes and mid-latitude trough. ?A? marks the rainfall maximum along front north of Agnes and ?B? marks rainfall maximum in the right forward quadrant of Agnes. (b) Picture of flooded areas in Pennsylvania (more than 1500km from where Agnes made landfall).
|
|
|
credits:
Evans and Hart 2003
copyright terms:
COMET Standard Terms of Use
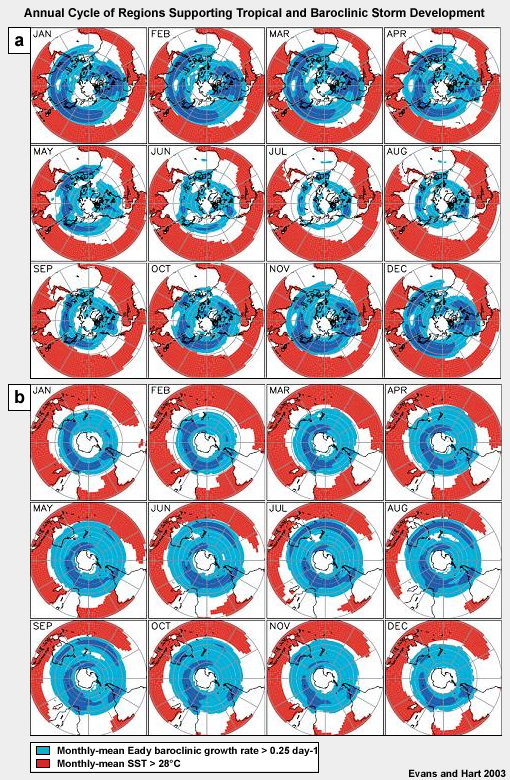
description:
Annual cycle of the geographic distribution of regions supporting tropical and baroclinic storm development in the a) Northern and b) Southern Hemispheres. Light (medium) blue shading indicates regions in which the monthly-mean Eady baroclinic growth rate of the most unstable mode is greater than 0.25 day-1 (0.5 day-1); regions of monthly-mean SST>28°C are shaded in red. These diagnostics are calculated from 2.5°×2.5° fields (1982?2001 NCEP/NCAR monthly mean reanalyses39), so extreme values are likely underestimated.
|
|
credits:
Ferreira and Schubert 1997
copyright terms:
COMET Standard Terms of Use
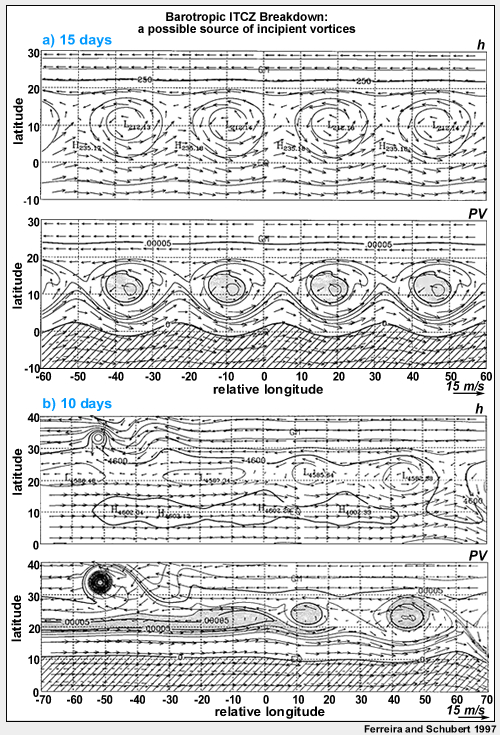
description:
Barotropic ITCZ breakdown simulations from Ferreira and Schubert (1997) illustrating (a) breakdown of the convective ITCZ in isolation; and (b) accelerated breakdown of the convective ITCZ in the presence of an existing tropical cyclone.
|
|
|
credits:
COMET
copyright terms:
COMET Standard Terms of Use
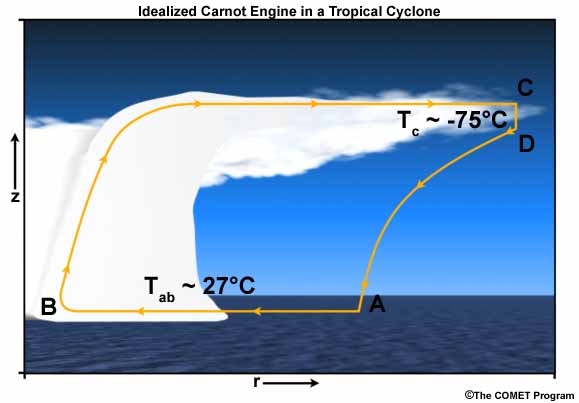
description:
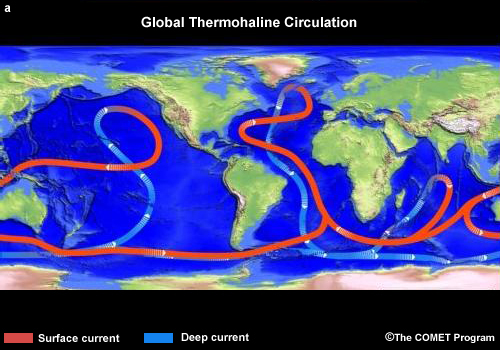
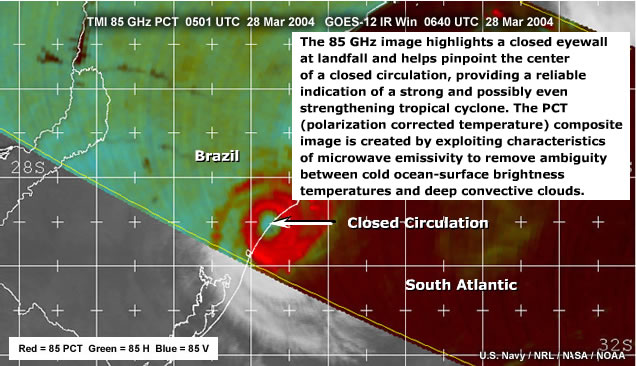
Schematic of the energy flux in a tropical cyclone idealized as a Carnot engine. Air in the atmospheric boundary layer flows in isothermally, rises up adiabatically in the eyewall convection, flows out to great distance isothermally near the tropopause, then sinks far from the storm. See the text for details of this conceptual model.
|
credits:
NASA
copyright terms:
COMET Standard Terms of Use
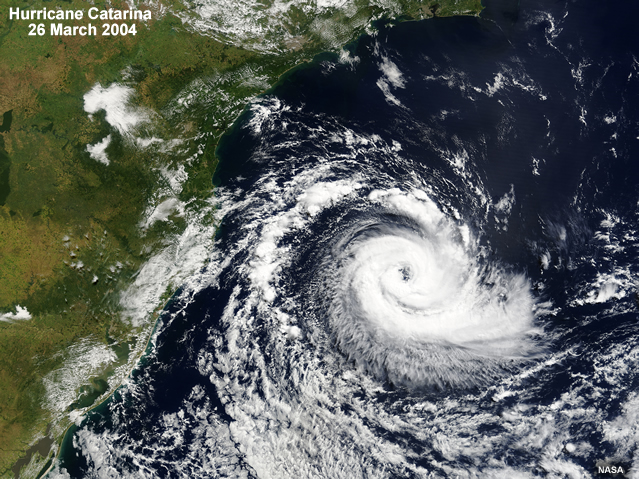
description:
Imagen satelital de huracán Catarina en el Atlántico Sur en el año 2004
|
|
credits:
US Navy\NRL\
copyright terms:
COMET Standard Terms of Use
description:
85GHz microwave image of Tropical Cyclone Catarina taken by the TRMM Microwave Imager (TMI) at 0501UTC 28 March 2004
|
|
credits:
NOAA
copyright terms:
COMET Standard Terms of Use
description:
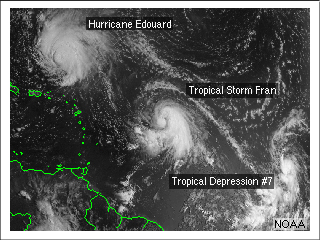
Satellite image of a tropical depression, tropical storm, and hurricane
|
credits:
NOAA/NWS
copyright terms:
COMET Standard Terms of Use
description:
Lightning flashes and radar reflectivity of Hurricane Charley (2004).
|
credits:
(c) The COMET Program
copyright terms:
COMET Standard Terms of Use
description:
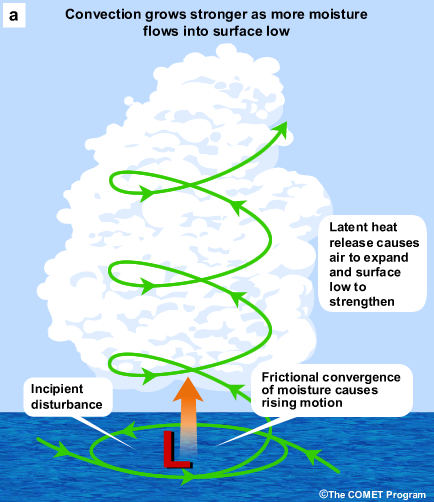
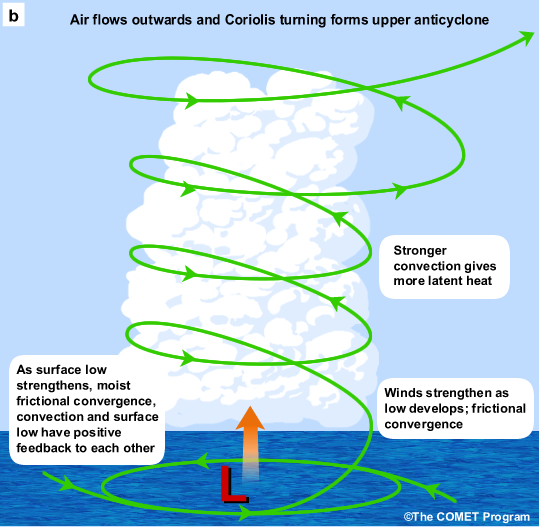
Conceptual model of CISK (Conditional Instability of the Second Kind), Stage 1
|
credits:
(c) The COMET Program
copyright terms:
COMET Standard Terms of Use
description:
Conceptual model of CISK (Conditional Instability of the Second Kind), Stage 2
|
credits:
NOAA
copyright terms:
COMET Standard Terms of Use
description:
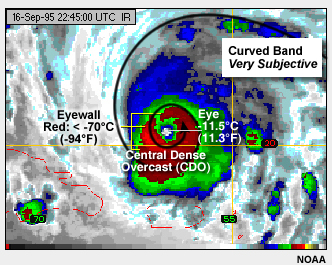
Example of the eyewall pattern and subjective curved band pattern from enhanced IR image.
|
credits:
a) NASA b) NASA (c and d) US Navy/NRL/NASA
copyright terms:
COMET Standard Terms of Use
description:
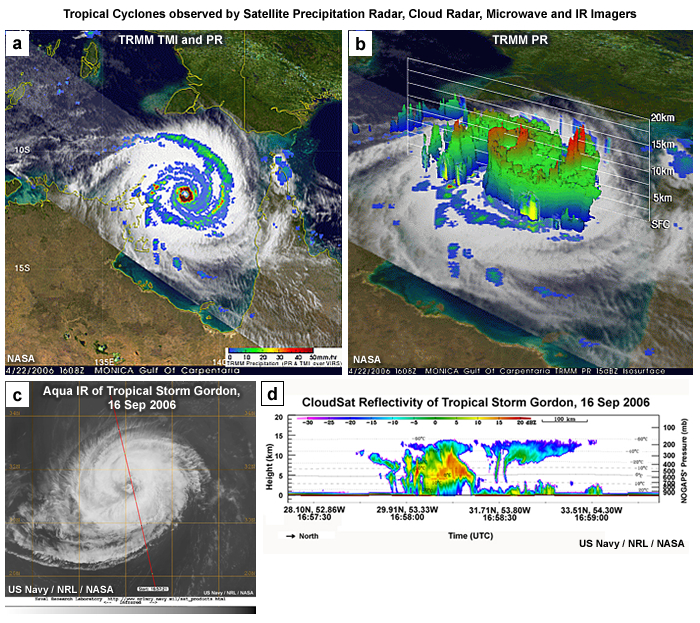
Tropical Cyclone Monica(2006) as observed by (a) the Tropical Rainfall Measurement Mission (TRMM) Precipitation Radar (PR), TRMM Microwave Imager (TMI), and Visible Infrared Scanner (VIRS); (b) 3D radar reflectivity from the TRMM PR; (c) Aqua-EOS IR; and (d) CloudSat reflectivity profile along the red line in (c).
|
credits:
US Navy/NRL/ (c)EUMETSAT 2007
copyright terms:
COMET Standard Terms of Use
description:
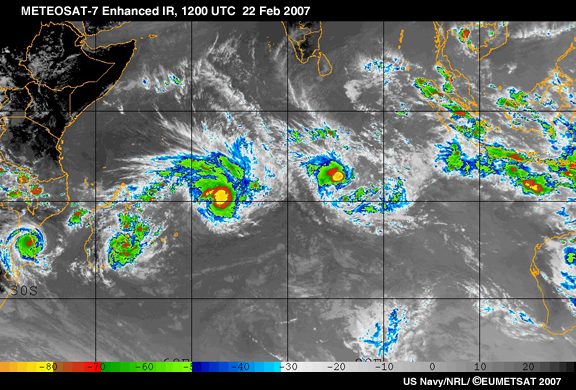
Enhanced IR image of four tropical cyclones at 1200UTC 22 Feb 2007
|
|
credits:
US Navy/NRL/ (c)EUMETSAT 2007
copyright terms:
COMET Standard Terms of Use
description:
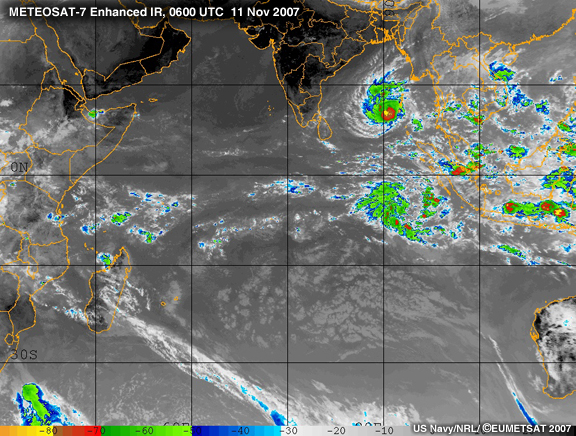
Meteosat Enhanced IR at 0600 UTC 11 Nov 2007 of NH and SH twin tropical cyclogenesis - indicative of equatorial Rossby wave generation
|

view/save .swf file
credits:
US Navy/NRL/ (c)EUMETSAT 2007
copyright terms:
COMET Standard Terms of Use
description:
Meteosat Enhanced IR images from 0000 UTC 12 Nov 2007 to 2100UTC 15 Nov demonstrating equatorial Rossby wave case of twin tropical cyclogenesis (Sidr in NH, Lee-Ariel in SH)
|
|
|
|
|
|
credits:
NCAR/EOL
copyright terms:
COMET Standard Terms of Use
description:
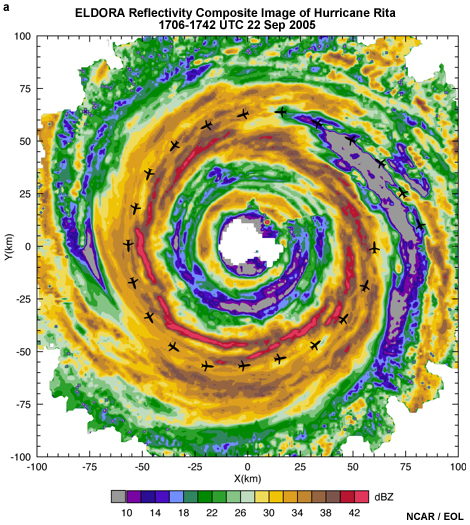
Radar reflectivity composite image of Hurricane Rita taken by ELDORA, 22 Sep 2005, during the Hurricane Rainband and Intensity Change Experiment (RAINEX). The flight track is marked by little airplane markers.
|
credits:
Upper panel - Gray (1984), Lower panel - NOAA/PEAC
copyright terms:
COMET Standard Terms of Use
description:
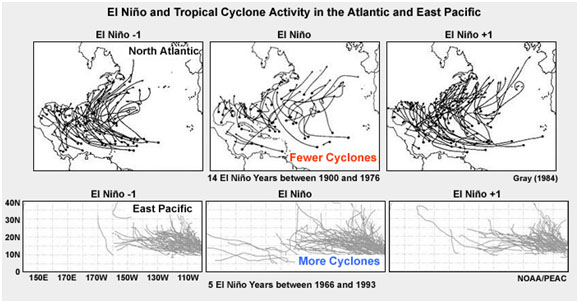
El Nino and Tropical Cyclone Activity in the North Atlantic and East Pacific
|
|
|
credits:
NASA
copyright terms:
COMET Standard Terms of Use
description:
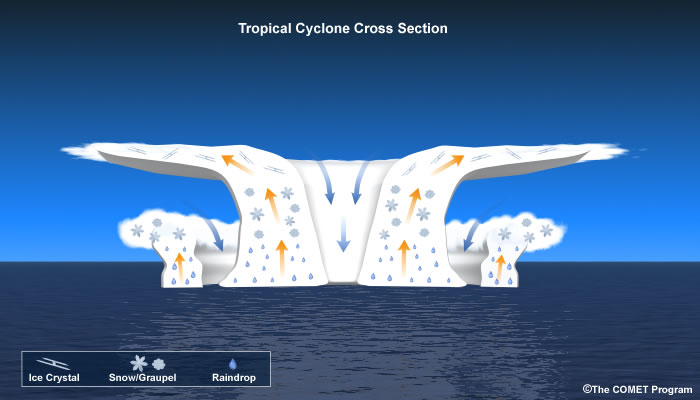
Schematic of the cross-section through a tropical cyclone showing the vertical airflow and microphysics in the eyewall and rain bands.
|
|

credits:
NASA
copyright terms:
COMET Standard Terms of Use
description:
Global distribution of observed tropical cyclone tracks from 1851-2006. Color shades show Saffir-Simpson Hurricane Intensity Scale
|
|
|
|
|
credits:
COMET
copyright terms:
COMET Standard Terms of Use
description:
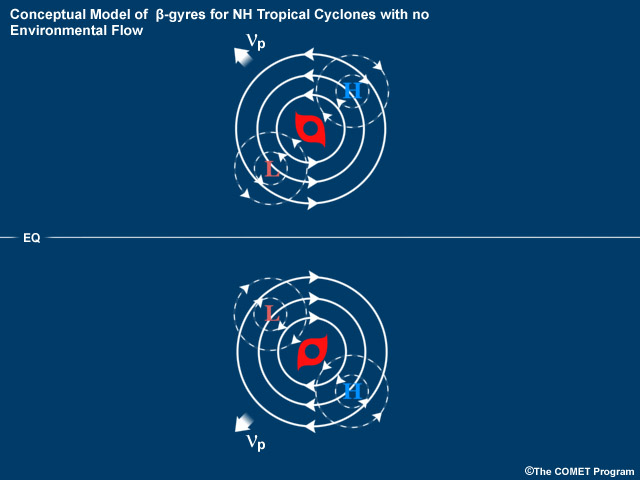
Beta-gyres in north and south hemisphere (with no environmental flow)
|
|
credits:
(copyright symbol) EUMETSAT 2007
copyright terms:
COMET Standard Terms of Use
description:
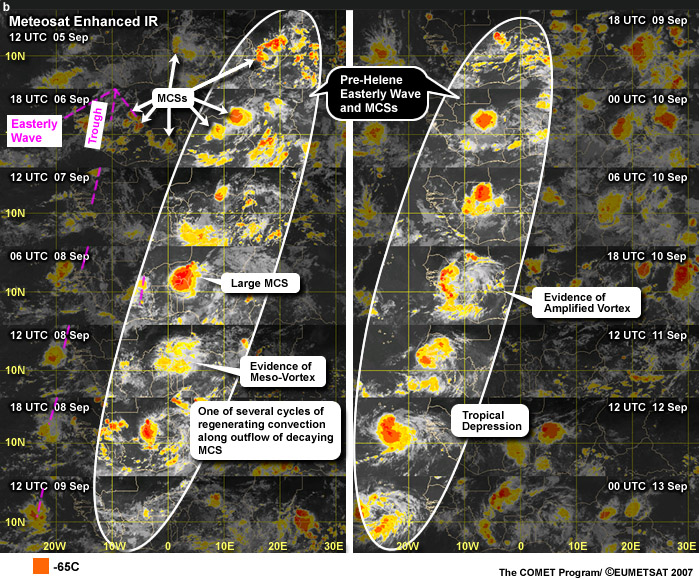
Enhanced IR images of African Easterly Waves and MCSs between 1200 UTC 5 Sep and 0000 UTC 13 Sep 2006
|
|
|
|
credits:
NASA /NOAA see revision
copyright terms:
COMET Standard Terms of Use
description:
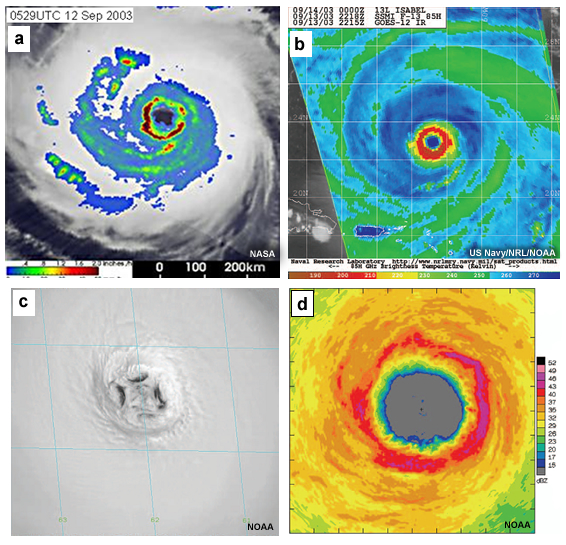
Satellite and airborne radar imagery of Hurricane Isabel. (a) TRMM PR image at 0529 UTC on 12 September 2003; (b) SSM/I 85-GHz brightness temperature at 2218 UTC (courtesy of NRL/Monterey);(b) visible image at 1745 UTC from GOES super-rapidscan operations; and (c) radar reflectivity (dBZ) from lower-fuselage (5 cm) radar onboard NOAA aircraft while flying inside the eye at ~2 km altitude. The time of the radar image (1747 UTC) is 2 min after the visible image shown in (b). The horizontal scales are approximately 1400 in (b), 300 in (c), and 180 kmin (d).
|
|
|
credits:
Holland and Merrill 1984, RMetS
copyright terms:
COMET Standard Terms of Use
description:
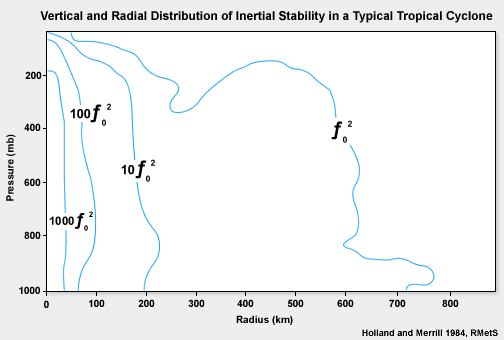
Vertical and radial distribution of inertial stability in a typical tropical cyclone. Figure is from Holland and Merrill (1984), their Figure 6a.
|
|
|
|
credits:
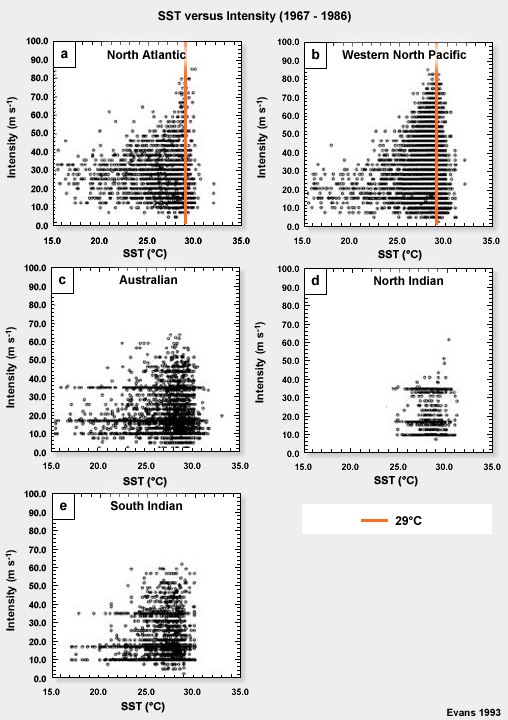
Evans 1993
copyright terms:
COMET Standard Terms of Use
description:
Intensity (ms-1) against SST (°C) for (a) North Atlantic, (b) western North Pacific, (c) Australian, (d) North Indian, and (e) South Indian basins. All storm observations for the 20 year period 1967-1986 are included.
|
credits:
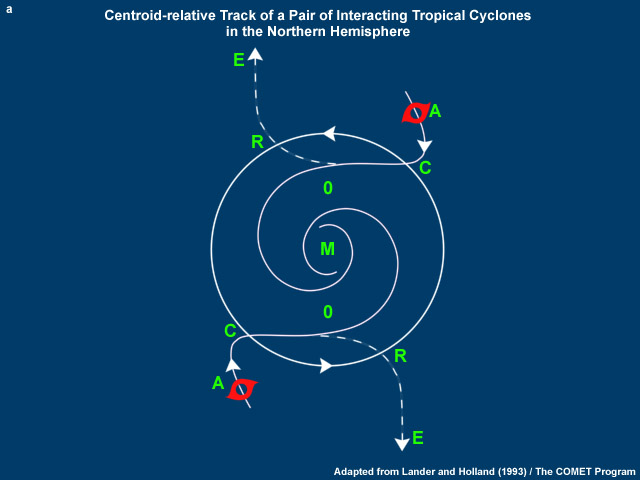
COMET
copyright terms:
COMET Standard Terms of Use
description:
Centroid-relative track of a pair of interacting NH tropical cyclones illustrating the four stages of storm-storm interactions: (i) Approach and Capture, (ii) Mutual Orbit, (iii) Merger, and (iv) Escape.
|
credits:
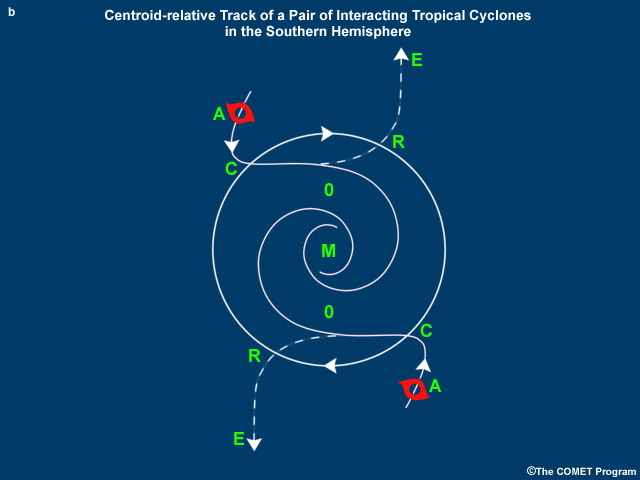
COMET
copyright terms:
COMET Standard Terms of Use
description:
Centroid-relative track of a pair of interacting tropical cyclones illustrating the four stages of storm-storm interactions: (i) Approach and Capture, (ii) Mutual Orbit, (iii) Merger, and (iv) Escape.
|
credits:
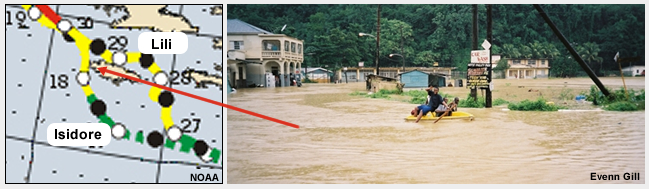
NOAA / Evenn Gill
copyright terms:
COMET Standard Terms of Use
description:
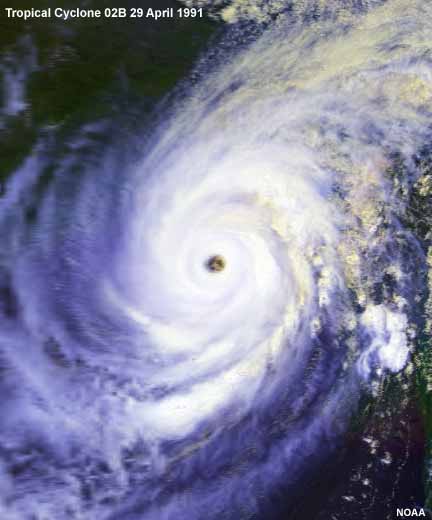
(a) tracks of Tropical Storms Isidore and Lili (2002), (b) flooding in Maggotty, southwestern Jamaica, 30 September 2002.
|
credits:
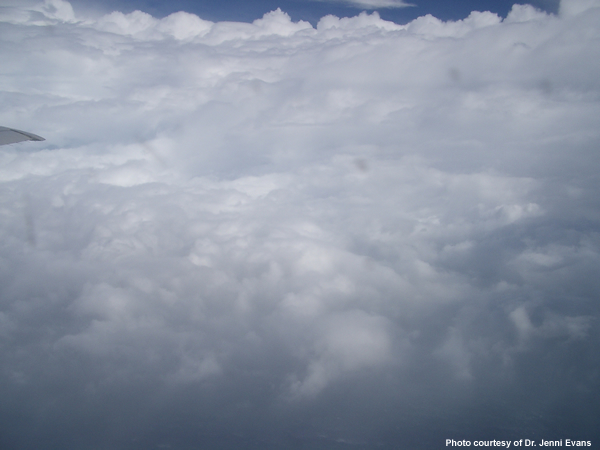
Photo courtesy of Dr. Jenni Evans
copyright terms:
COMET Standard Terms of Use
description:
Photograph of the sloping eyewall of Hurricane Ivan (2004). Photograph taken by Jenni Evans from the NOAA WC-130 mission flying into Ivan the night before it made landfall on the Gulf of Mexico coast.
|
credits:
Leave credit as is
copyright terms:
COMET Standard Terms of Use
description:
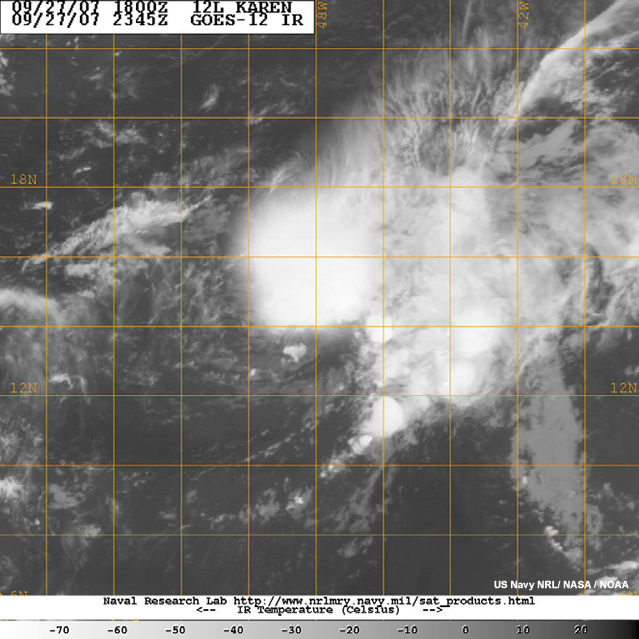
IR satellite of Hurricane Karen 27 Sept. 2007 1800Z
|
credits:
Leave credit as is
copyright terms:
COMET Standard Terms of Use
description:
IR satellite of Hurricane Karen 27 Sept. 2007 1800Z
|
credits:
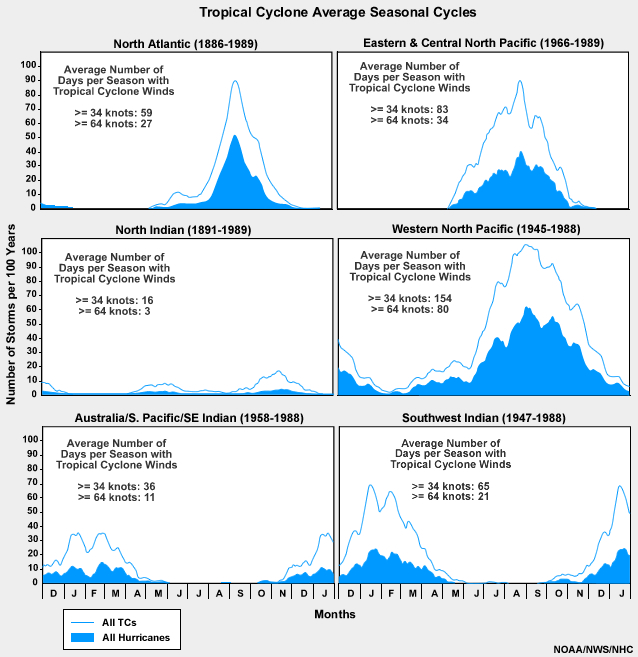
NOAA/NWS/NHC
copyright terms:
COMET Standard Terms of Use
description:
Average number of days with tropical cyclones in all basins
|
credits:
US Navy/NRL/Eumetsat 2007
copyright terms:
COMET Standard Terms of Use
description:
IR-BD enhanced images of Tropical Cyclone Indlala with central pressure of (a) 994hPa, (b) 984hPa, (c) 967hPa, and (d) 927hPa
|
credits:
U.S. Navy/NRL/CIMSS
copyright terms:
COMET Standard Terms of Use
description:
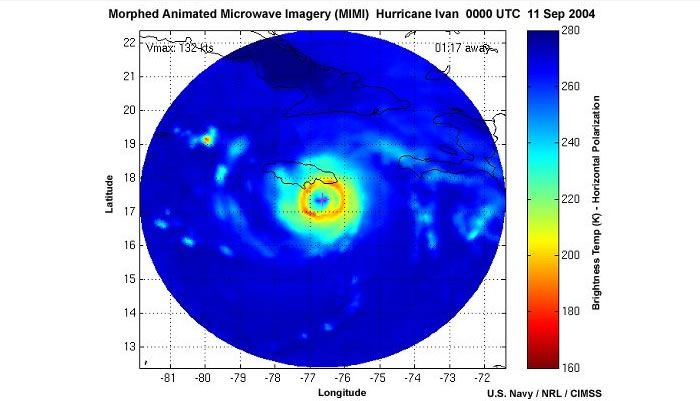
MIMIC sequence of morphed and observed microwave images of Hurricane Ivan, September 2004.
|
credits:
rainrate maps - US Navy/NRL/NOAA, large image - NOAA/NESDIS
copyright terms:
COMET Standard Terms of Use
description:
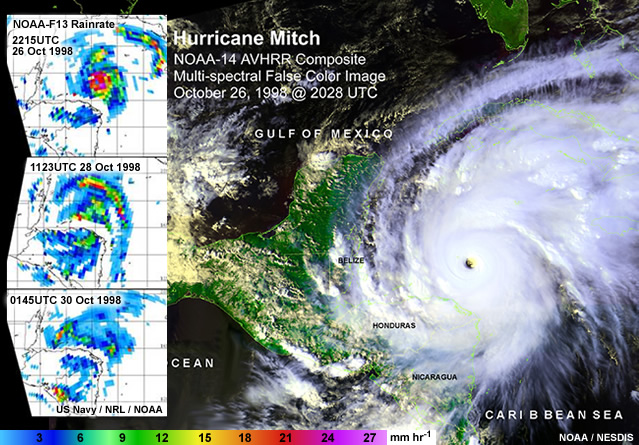
False color sat image of Hurricane Mitch on 26 Oct 1998, at peak intensity of 80 meters per second, and satellite-derived rainrates (NOAA-F13 microwave instrument), 26-30 October 1998
|
credits:
COMET
copyright terms:
COMET Standard Terms of Use
description:
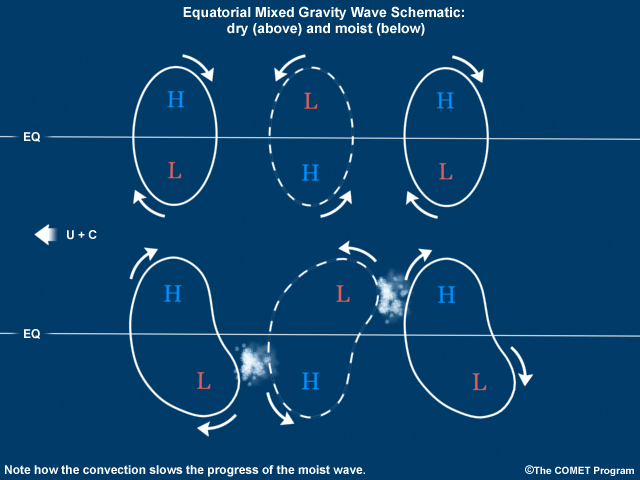
Schematic of the pressure and wind anomalies for a dry mixed Rossby gravity wave (westward propagation). Convergence zones are indicated by hatching; b) schematic pressure and wind anomalies for an idealized moist mixed Rossby gravity wave. Convective activity is indicated by hatched regions. The moist convection distorts the wave signature and slows its movement;
|
credits:
copyright terms:
COMET Standard Terms of Use
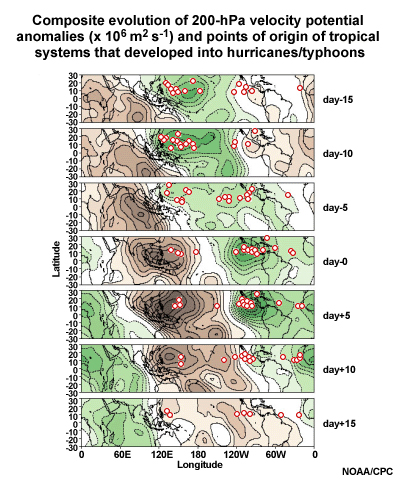
description:
Points of origin of tropical systems that developed into tropical cyclones (red circles) relative to phases of the MJO
|
credits:
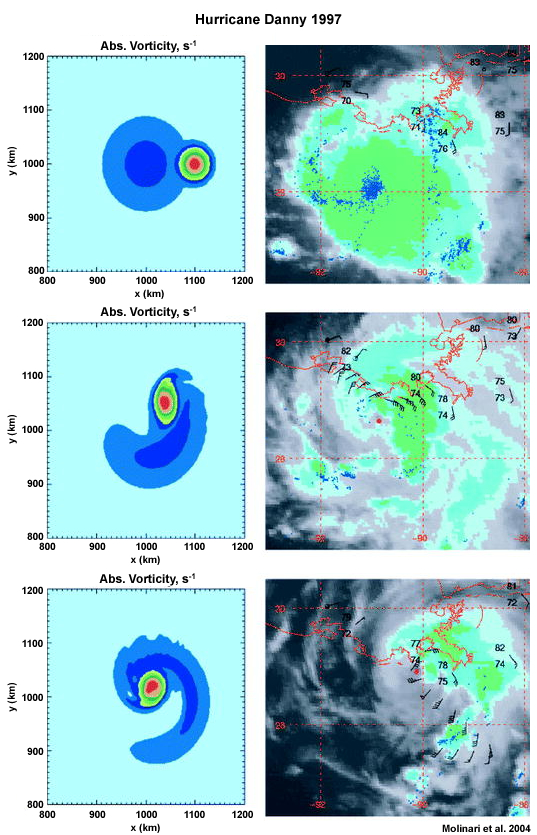
Molinari et al. 2004
copyright terms:
COMET Standard Terms of Use
description:
Idealized model (left) and satellite imagery (right) depicting the development of Hurricane Danny (1997) from weak tropical storm (top) to marginal hurricane (bottom).
|
credits:
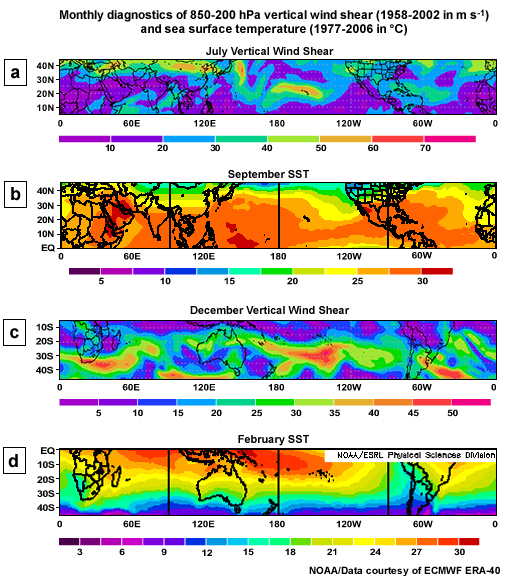
NOAA/Data courtesy of ECMWF ERA-40
copyright terms:
COMET Standard Terms of Use
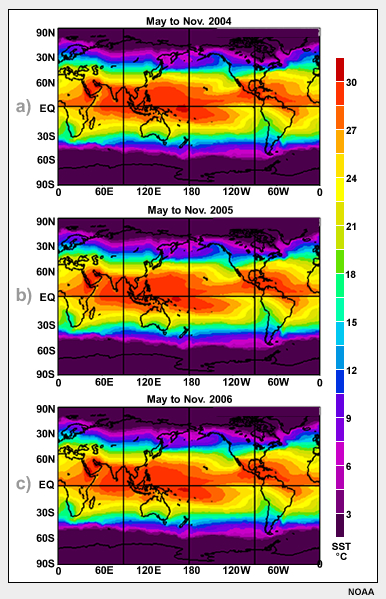
description:
Monthly diagnostics of 850-200 hPa vertical wind shear (1958 2002 in m s-1) and sea surface temperature (1977 2006 in °C).
|
credits:
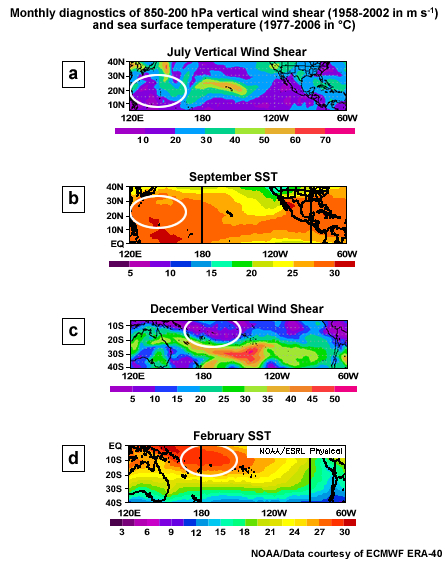
NOAA/Data courtesy of ECMWF ERA-40
copyright terms:
COMET Standard Terms of Use
description:
Monthly diagnostics of 850-200 hPa vertical wind shear (1958 2002 in m s-1) and sea surface temperature (1977 2006 in °C).
|
credits:
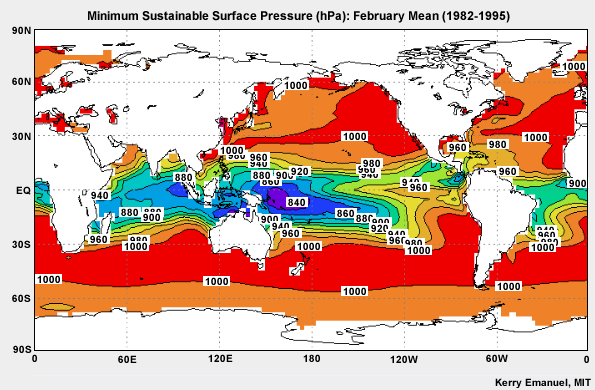
Kerry Emanuel, MIT
copyright terms:
COMET Standard Terms of Use
description:
Map of the climatological distribution of potential intensity (minimum sustainable surface pressure) in February (1982-1995)
|
credits:
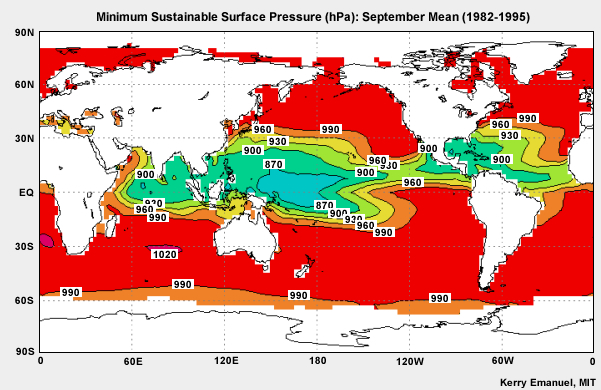
Kerry Emanuel, MIT
copyright terms:
COMET Standard Terms of Use
description:
Map of the climatological distribution of potential intensity in September (minimum sustainable surface pressure) in February (1982-1995)
|
credits:
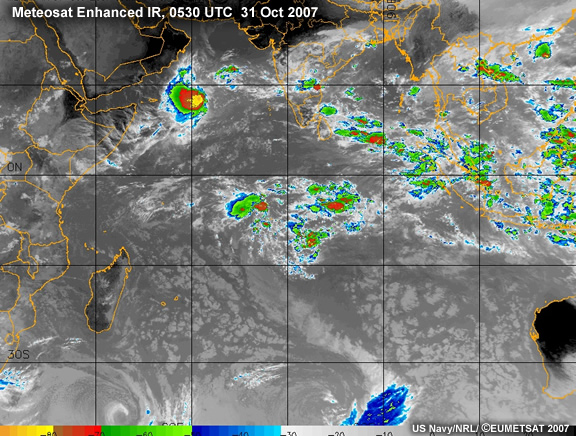
US Navy/NRL/ (copyrightsymbol) EUMETSAT 2007
copyright terms:
COMET Standard Terms of Use
description:
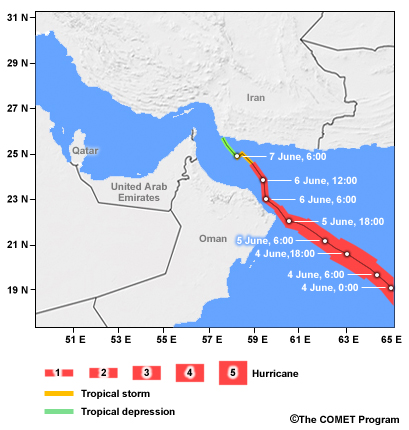
Meteosat enhanced IR image 0530 UTC 31 Oct illustrating cyclogenesis associated with a Mixed Rossby Gravity wave. TC 05A over the Arabian Sea
|

view/save .swf file
credits:
US Navy/NRL/ (copyrightsymbol) EUMETSAT 2007
copyright terms:
COMET Standard Terms of Use
description:
Animation of Meteosat enhanced IR images from 00Z 30 Oct - 18Z 1 Nov 2007 demonstrating cyclogenesis associated with a Mixed Rossby Gravity wave
|
credits:
COMET
copyright terms:
COMET Standard Terms of Use
description:
Schematic of the cross-section through a tropical cyclone showing the vertical airflow and microphysics in the eyewall and rain bands
|
credits:
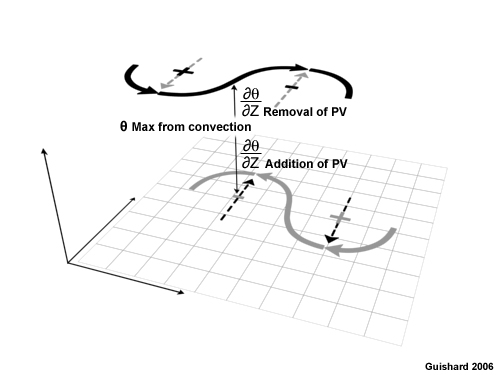
Guishard 2006
copyright terms:
COMET Standard Terms of Use
description:
Schematic of upper and lower PV perturbation waves undergoing baroclinic growth as an initially subtropical system. Convective heating between the layers may modify the system by diabatic rearrangement of PV
|
credits:
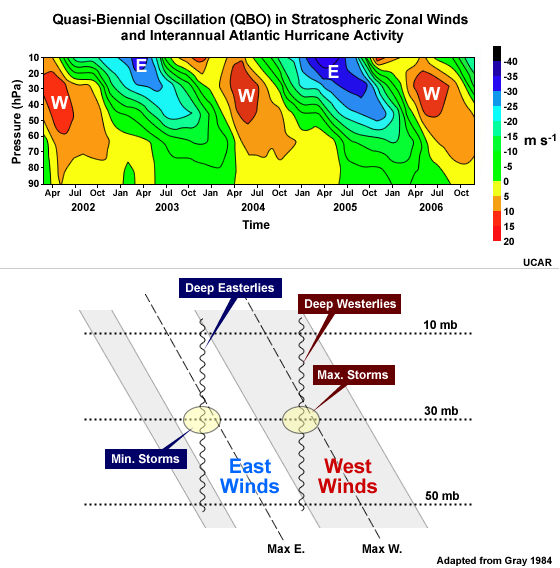
Lower panel - Gray 1984 , Upper panel - UCAR
copyright terms:
COMET Standard Terms of Use
description:
Quasi-Biennial Oscillation (QBO) in Stratospheric Zonal Winds
and Interannual Atlantic Hurricane Activity
|
credits:
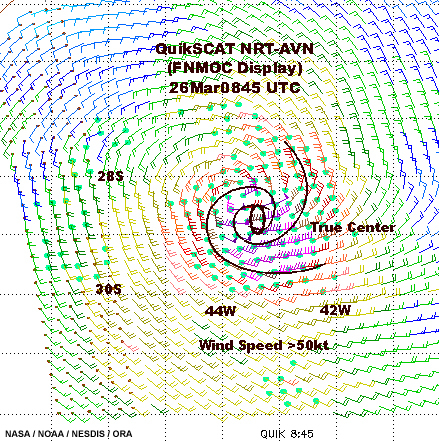
NASA/NOAA/NESDIS/ORA
copyright terms:
COMET Standard Terms of Use
description:
QuikSCAT scan of Tropical Cyclone Catarina at 0845 UTC March 26th 2004
|
credits:
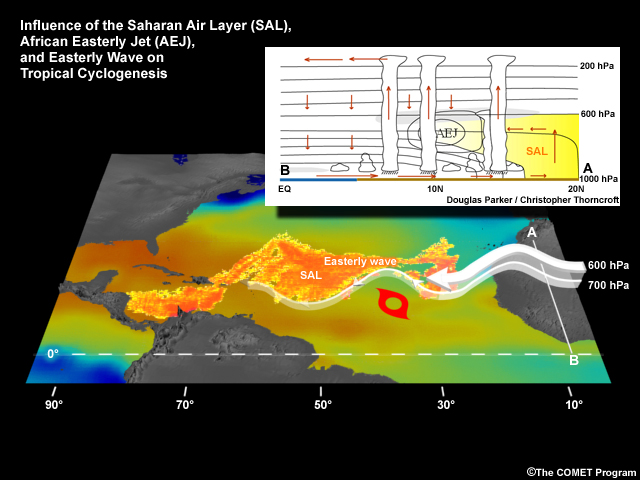
copyright symbol The COMET Program / Cross-section credit: Douglas Parker/ Christopher Thorncroft
copyright terms:
COMET Standard Terms of Use
description:
Schematic of the Saharan Air Layer, African Easterly Jet, and influences on genesis
|
credits:
COMET/US.Navy/NRL/NASA/JWA
copyright terms:
COMET Standard Terms of Use
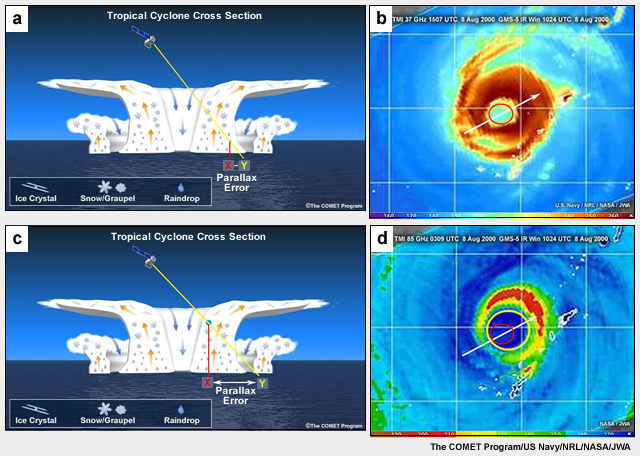
description:
Conceptual model of the relative parallax errors in satellite microwave images of (upper) 37GHz liquid droplet emissions and location of the eye of Typhoon Jelawat and (lower) same as upper except for 85GHz ice scattering. The red circle is the 37GHz eye position and the yellow circle is the 85GHz position.
|
credits:
See instructions above
copyright terms:
COMET Standard Terms of Use
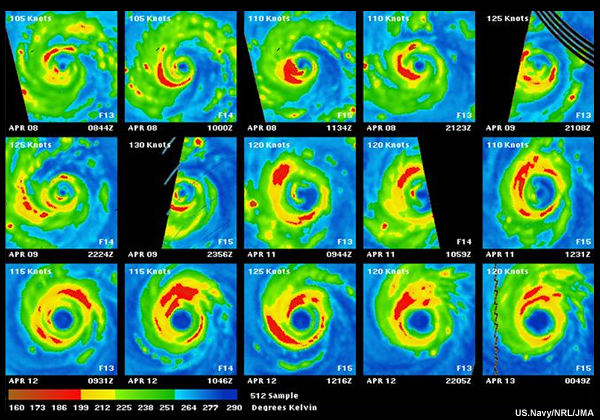
description:
Eyewall replacement cycle in Typhoon Sudal in the West Pacific, seen in SSM/I 85Ghz H-Polarized image from 8-13 April 2004
|
credits:
Holland and Merrill 1984
copyright terms:
COMET Standard Terms of Use
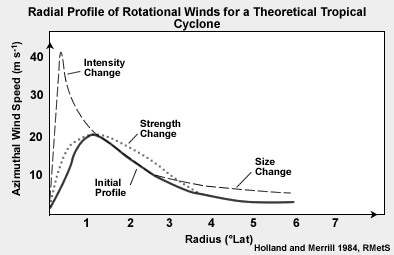
description:
The radial profile of rotational winds for a typical tropical cyclone. The three regions being considered are (1) the eye (inside the radius of maximum winds), (2) the region of winds storm strength (17 ms-1) or higher, and (3) the outer storm. Also pictured here are the variations in this radial profile due to intensity, strength, and size changes
|
credits:
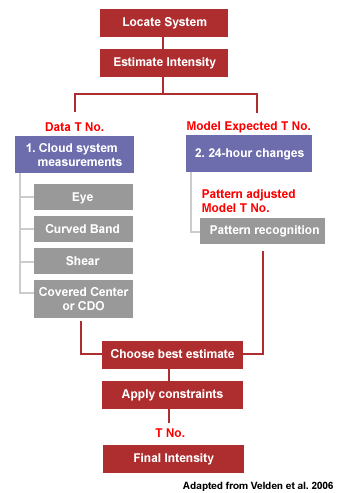
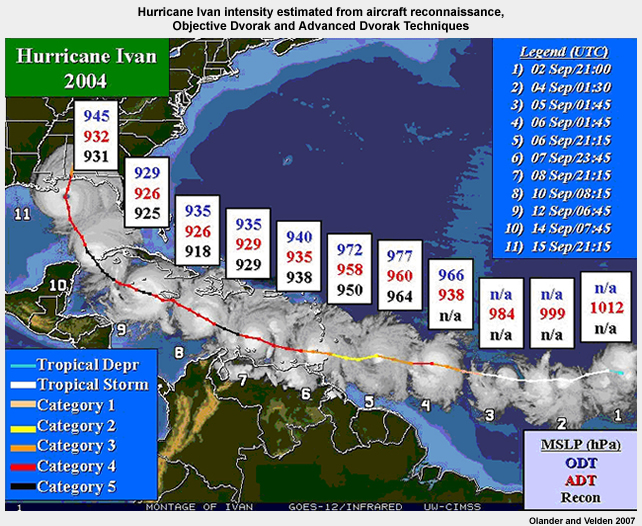
Olander and Velden 2007
copyright terms:
COMET Standard Terms of Use
description:
Comparison of the TC intensity estimates from aircraft reconnaissance, ODT, ADT
|
credits:
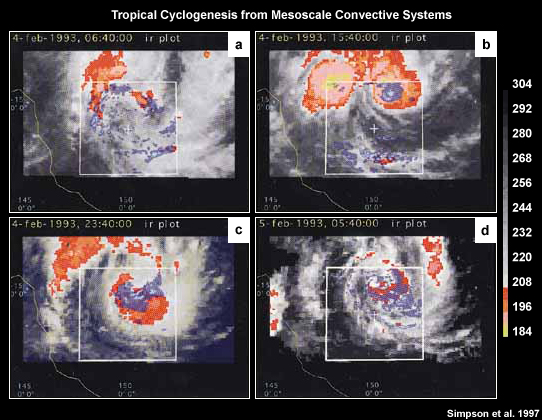
Simpson et al. 1997
copyright terms:
COMET Standard Terms of Use
description:
Development of Tropical Cyclone Oliver from the merger of mesoscale convective systems
|
credits:
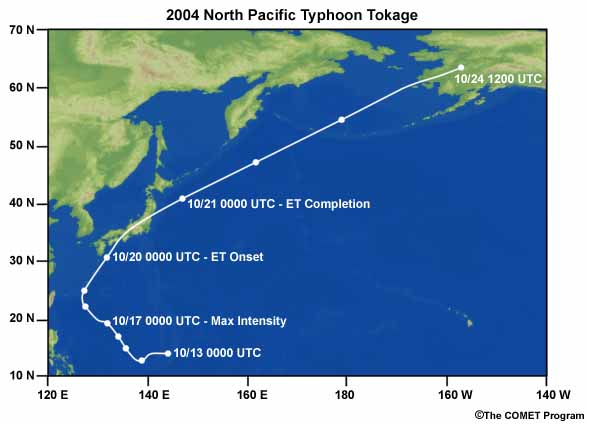
The COMET Program
copyright terms:
COMET Standard Terms of Use
description:
Extended best track of North Pacific Typhoon Tokage (2004).
|
credits:
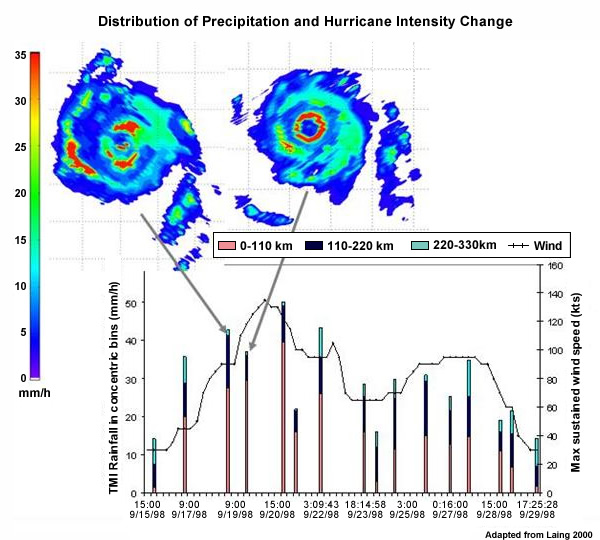
Adapted from Laing 2000
copyright terms:
COMET Standard Terms of Use
description:
Spatial distribution of surface rain rates (mm hr-1) in Hurricane Georges via TRMM TMI, best track maximum sustained wind speed (knots, solid black line), and rainfall in concentric bins around the center of the cyclone (mm hr-1, vertical bars).
|
credits:
COMET
copyright terms:
COMET Standard Terms of Use
description:
Schematic of an African easterly wave illustrating: (i) the ?inverted V? structure (relative to an on-equator perspective); (ii) surface isobars (dark dash); (iii) 700hPa streamlines (red); (iv) regions of surface convergence and divergence; and (v) eastward tilt of the wave with height (white lines with upper trough axis to east).
|
|
credits:
US.Navy/NRL/JMA
copyright terms:
COMET Standard Terms of Use
description:
Eyewall replacement cycle in Typhoon Sudal in the West Pacific, seen in SSM/I 85Ghz H-Polarized image from 8-13 April 2004
|
credits:
NOAA
copyright terms:
COMET Standard Terms of Use
description:
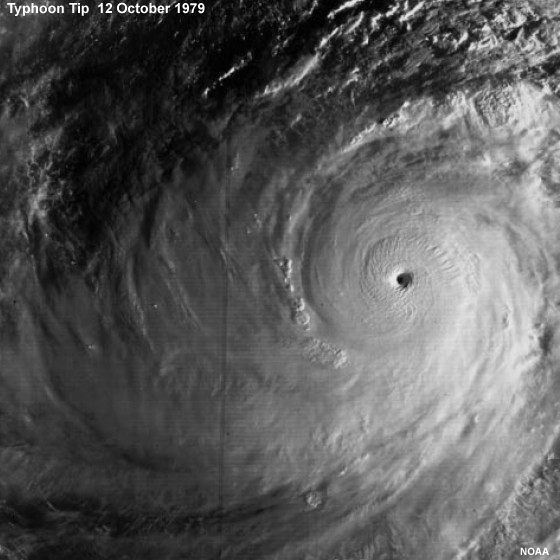
Sat image of Supertyphoon Tip which was legendary for its spatial extent as well as its intensity ? most of the North Pacific basin appeared to be rotating! At its most intense, the minimum sea level pressure of Tip was measured at 870 hPa at 0353 UTC on 12 October 1979. The estimated maximum sustained (1-minute) surface wind was 85 ms-1 (305 km h-1).
|
credits:
Corbosiero and Molinari 2002
copyright terms:
COMET Standard Terms of Use
description:
Demonstration of the impact of vertical wind shear on tropical cyclones of different intensity.29 The figure depicts the distribution of lightning flashes around (a) Hurricane Bertha (1996) and (b) weakening Tropical Storm Alberto (1994).
|
credits:
WMO
copyright terms:
COMET Standard Terms of Use
description:
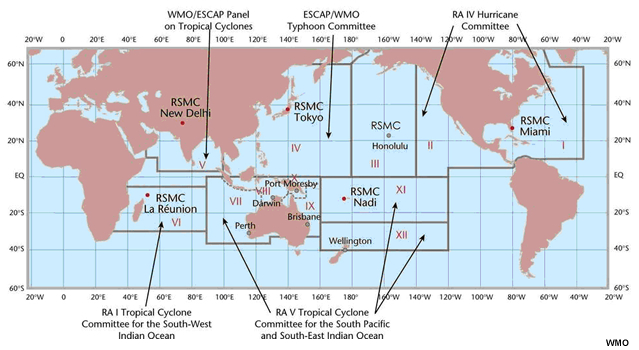
WMO Regions and Institutions with Tropical Cyclone forecasting responsibility
|