The following media items used in this module are protected by the details of their copyrights. Please use the "copyright terms" link associated with each media item below for more information.
Click an image to view it at full size in a new browser window/tab.
credits:
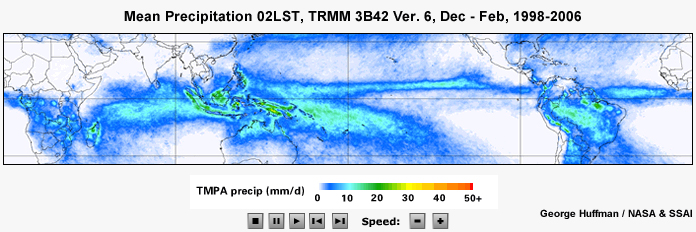
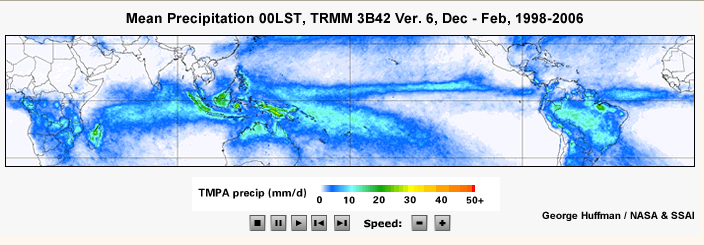
George Huffman / NASA & SSAI
copyright terms:
COMET Standard Terms of Use
description:
The diurnal cycle of tropical precipitation for December?February, from TRMM gridded precipitation data, 3B42 Version 6, 1998 to 2006
|
|
credits:
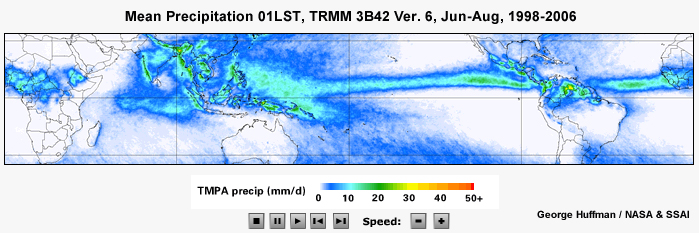
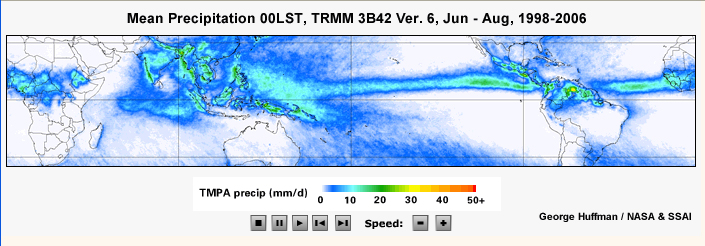
George Huffman / NASA & SSAI
copyright terms:
COMET Standard Terms of Use
description:
The diurnal cycle of tropical precipitation for June-August, from TRMM gridded precipitation data, 3B42 Version 6, 1998 to 2006.
|
|
credits:
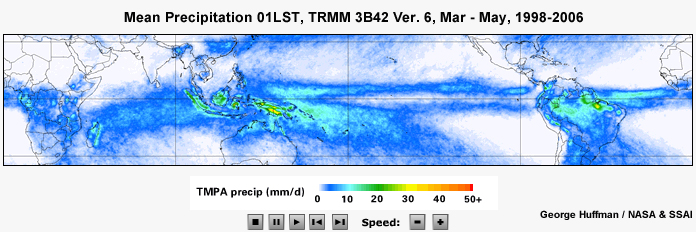
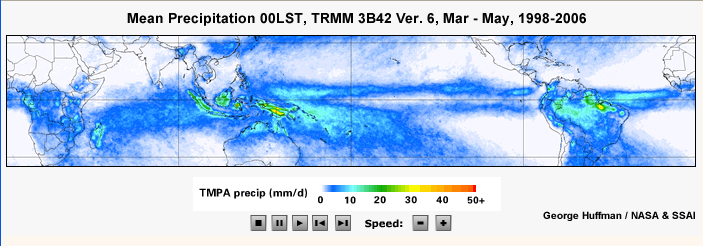
George Huffman / NASA & SSAI
copyright terms:
COMET Standard Terms of Use
description:
The diurnal cycle of tropical precipitation for March?May, from TRMM gridded precipitation data, 3B42 Version 6, 1998 to 2006.
|
|
credits:
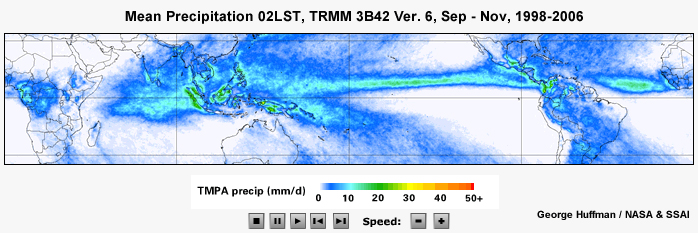
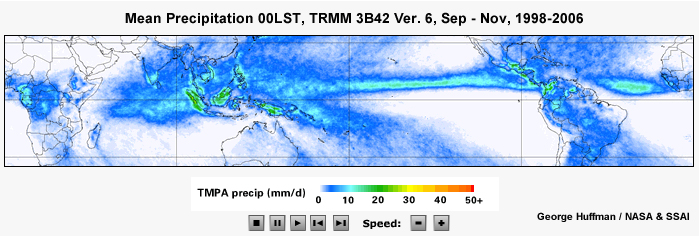
George Huffman / NASA & SSAI
copyright terms:
COMET Standard Terms of Use
description:
The diurnal cycle of tropical precipitation for September?November, from TRMM gridded precipitation data, 3B42 Version 6, 1998 to 2006
|
|
|
|
credits:
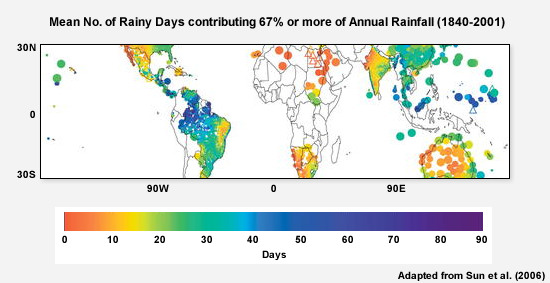
Adapted from Sun et al. (2006)
copyright terms:
COMET Standard Terms of Use
description:
Average number of rainy days contributing 67% or more of the annual rainfall during 1840-2001. Only years with great than 300 days are used. Open triangle are stations with less than 5 years of record
|
|
credits:
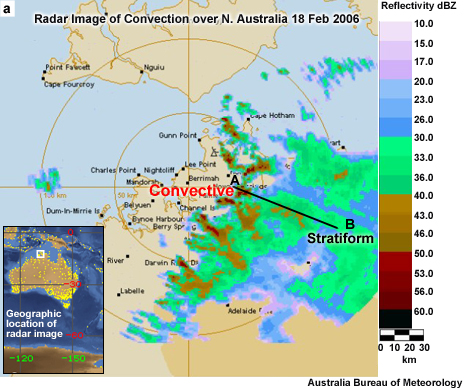
Australia Bureau of Meteorology
copyright terms:
COMET Standard Terms of Use
description:
Radar image showing a line of convective precipitation with trailing region of stratiform precipitation over northern Australia
|
credits:
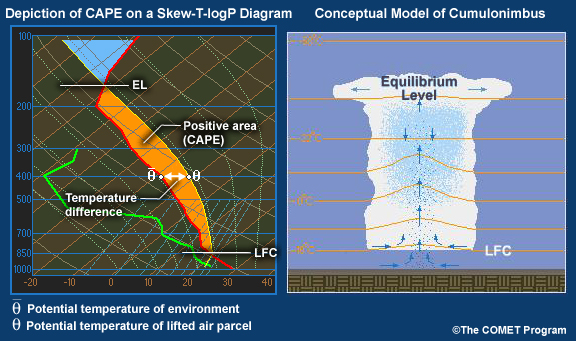
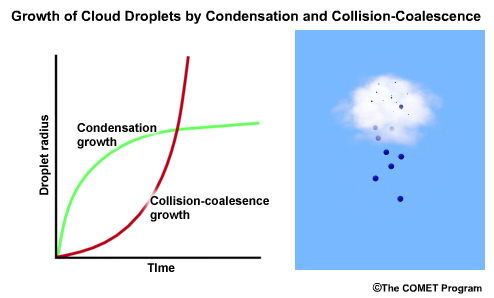
©The COMET Program
copyright terms:
COMET Standard Terms of Use
description:
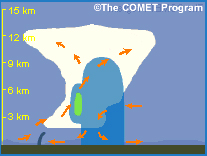
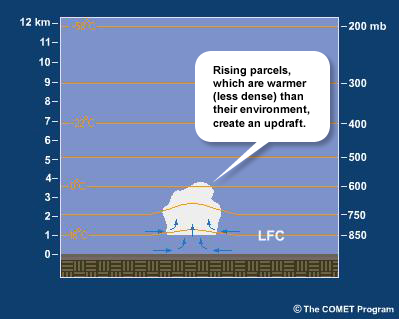
The depiction of CAPE on a Skew-T-logP diagram and a conceptual model of a corresponding mature cumulonimbus.
|
|
credits:
©The COMET Program
copyright terms:
COMET Standard Terms of Use
description:
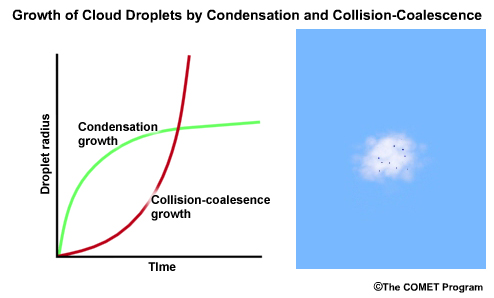
Static image of collision-coalescence (warm cloud processes)
|
credits:
©The COMET Program
copyright terms:
COMET Standard Terms of Use
description:
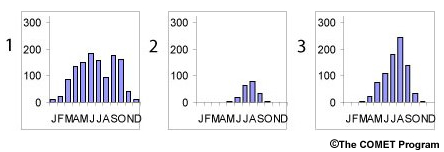
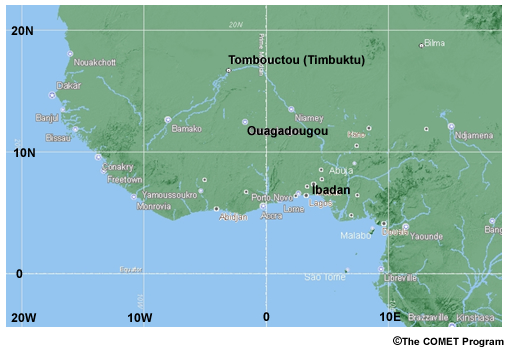
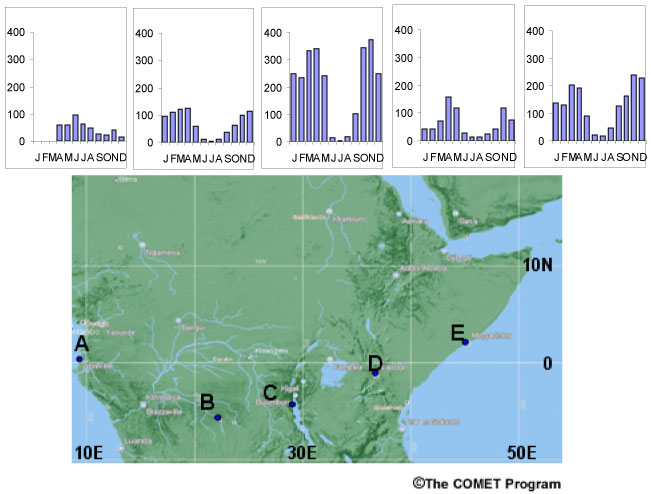
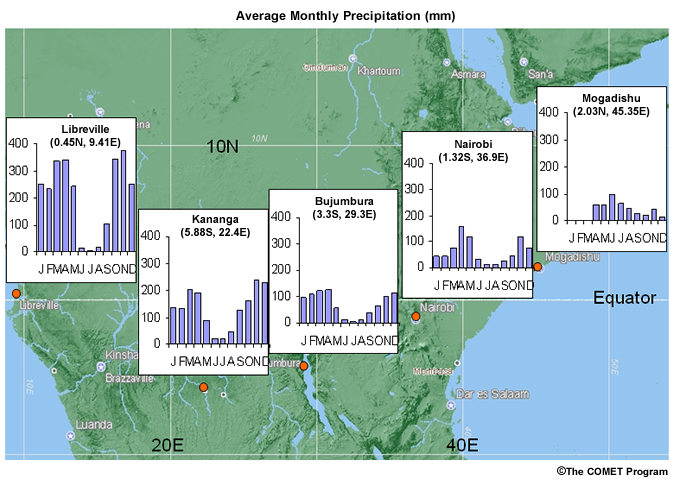
Monthly Mean Precipitation graphs and Stations in Central Africa
|
credits:
©The COMET Program
copyright terms:
COMET Standard Terms of Use
description:
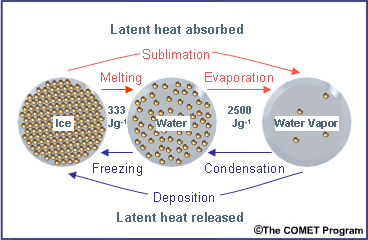
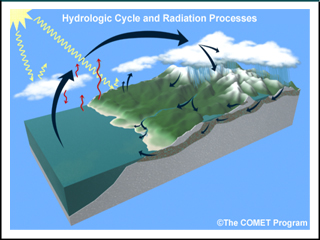
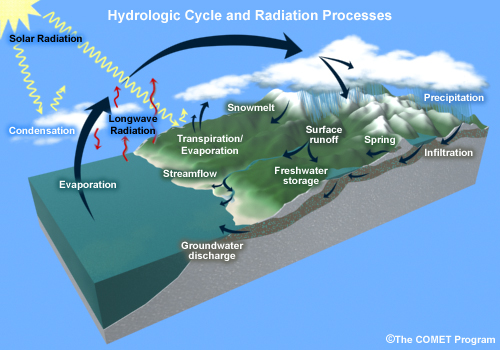
Moisture processes critical to weather and climate
|
|
credits:
©The COMET Program
copyright terms:
COMET Standard Terms of Use
description:
Conceptual model of the stages of moist, deep convection
|
|
|
|
credits:
©The COMET Program
copyright terms:
COMET Standard Terms of Use
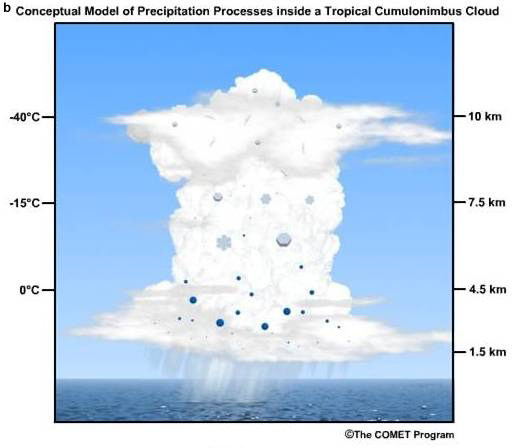
description:
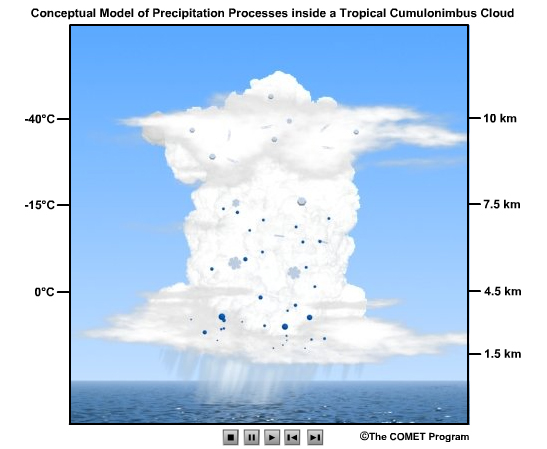
Distribution of hydrometeors in a cumulonimbus cloud
|
credits:
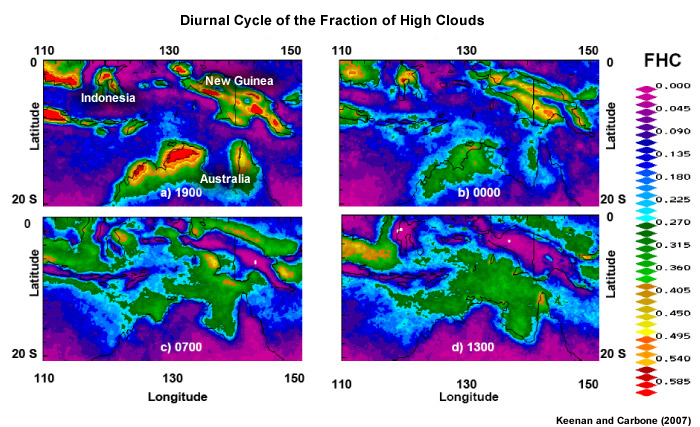
Keenan and Carbone (2007)
copyright terms:
COMET Standard Terms of Use
description:
Diurnal Cycle of Fraction of High Clouds over Northern Australia, Indonesia, and Papua New Guinea
|
credits:
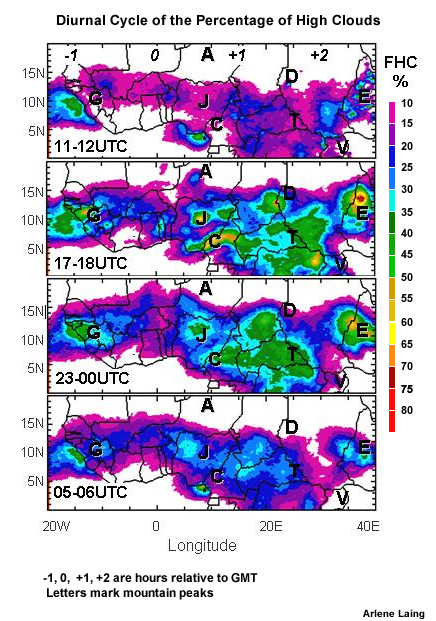
Arlene Laing
copyright terms:
COMET Standard Terms of Use
description:
Diurnal Cycle of Fraction of High Clouds over Northern Tropical Africa
|
credits:
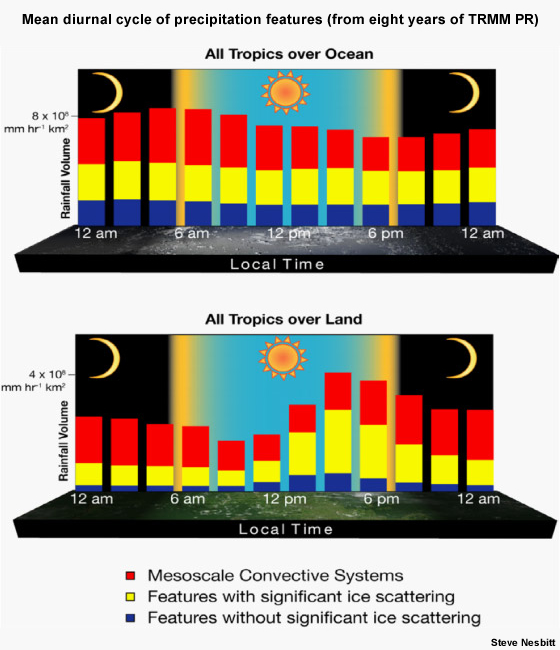
Steve Nesbitt
copyright terms:
COMET Standard Terms of Use
description:
Mean diurnal cycle of tropical precipitation features identified from eight years of TRMM PR data
|
credits:
AMS
copyright terms:
COMET Standard Terms of Use
description:
Drop sizes and number concentrations of maritime and continental cloud droplets.
|
credits:
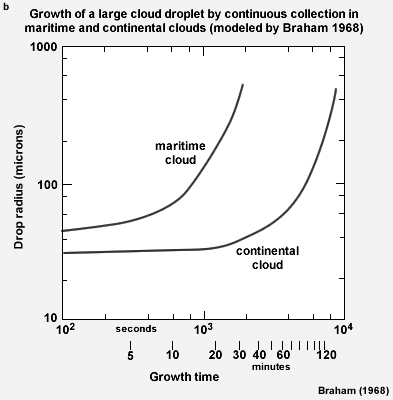
Braham (1968)
copyright terms:
COMET Standard Terms of Use
description:
Growth of a large cloud droplet by continuous collection in maritime and continental clouds (modeled by Braham 1968)
|
credits:
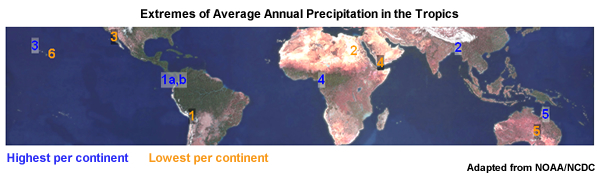
NOAA/NCDC
copyright terms:
COMET Standard Terms of Use
description:
Locations of Annual Precipitation Extremes for each continent
|
credits:
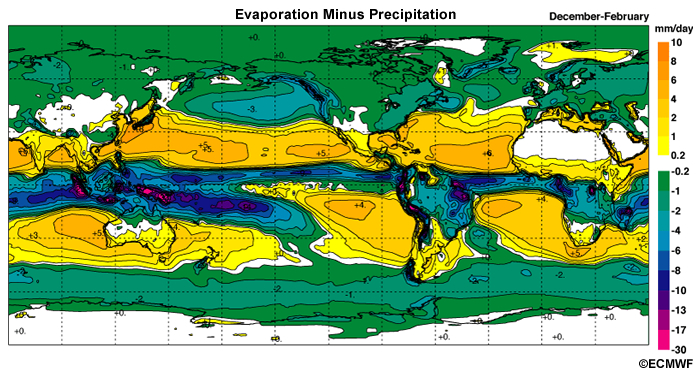
©ECMWF
copyright terms:
COMET Standard Terms of Use
description:
Mean evaporation minus precipitation ERA-40 Analysis for Dec - Feb
|
credits:
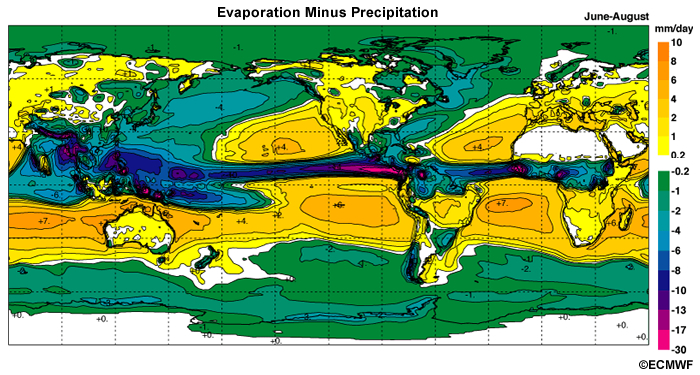
©ECMWF
copyright terms:
COMET Standard Terms of Use
description:
Mean evaporation minus precipitation ERA-40 Analyses for Jun - Aug
|
credits:
©ECMWF
copyright terms:
COMET Standard Terms of Use
description:
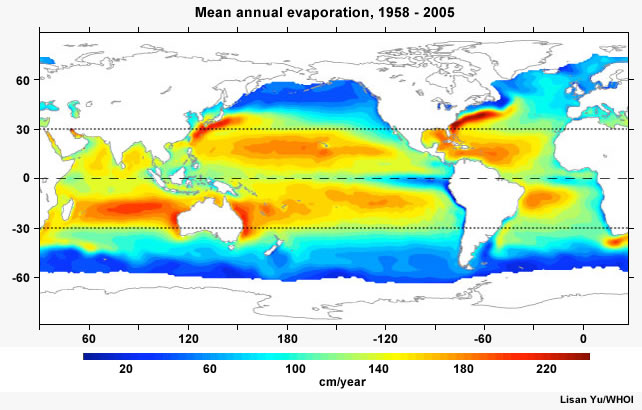
Annual mean evaporation minus precipitation (from the European Center for Medium-range Weather Forecast or ECMWF, ERA-40 Analyses)
|
credits:
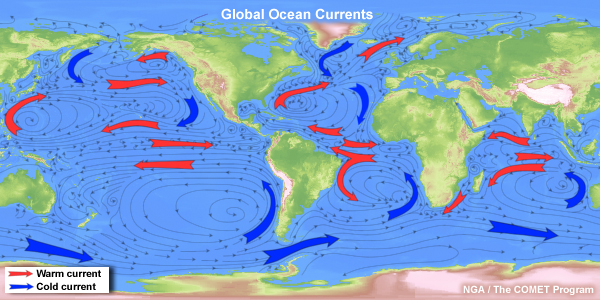
NGA / ©The COMET Program
copyright terms:
COMET Standard Terms of Use
description:
Global ocean surface currents and elevation
|
|
|
|
|
|
credits:
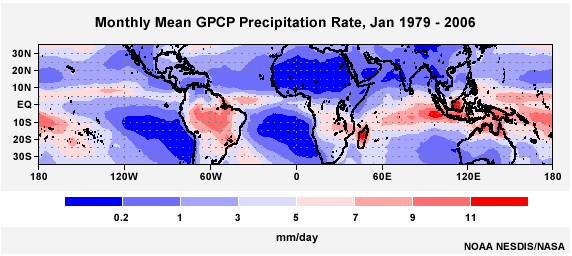
NOAA NESDIS/NASA
copyright terms:
COMET Standard Terms of Use
description:
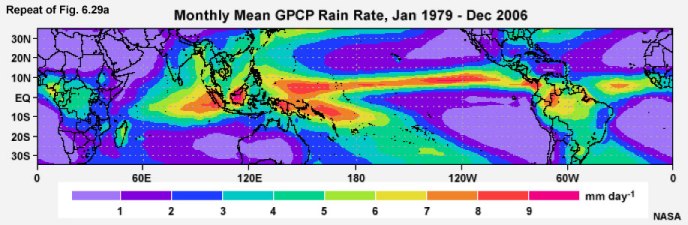
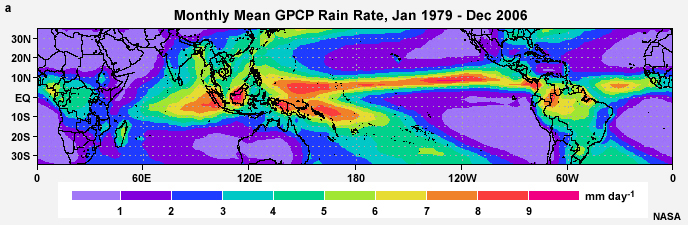
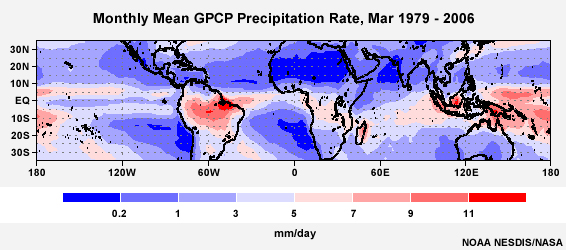
Static image of GPCP Monthly Mean precipitation (mm/day) Jan-Dec, 1979- 2006
|
|
credits:
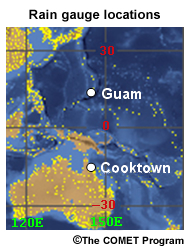
©The COMET Program
copyright terms:
COMET Standard Terms of Use
description:
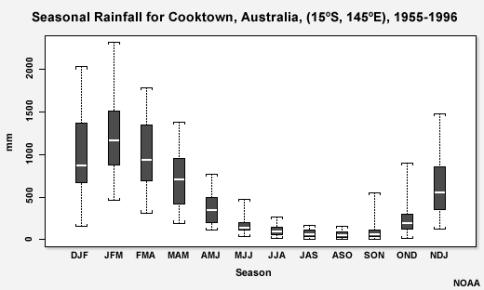
Geographic location of Guam and Cooktown, latitudinal opposites for seasonal precipitation comparison
|
|
|
|
credits:
©The COMET Program
copyright terms:
COMET Standard Terms of Use
description:
Moisture processes critical to weather and climate
|
credits:
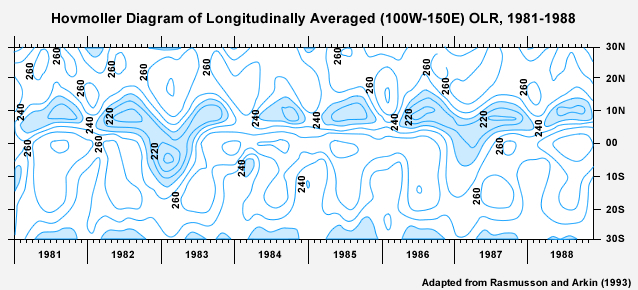
Adapted from Rasmusson and Arkin (1993)
copyright terms:
COMET Standard Terms of Use
description:
Hovmoller diagram of longitudinally averaged (100W-150E) OLR, 1981-1988
|
credits:
NASA
copyright terms:
COMET Standard Terms of Use
description:
Total fractional cloud cover (%) annual averaged from 1983 - 1990, compiled using data from the International Satellite Cloud Climatology Project (ISCCP)
|
|
|
|
|
|
credits:
NOAA/NESDIS
copyright terms:
COMET Standard Terms of Use
description:
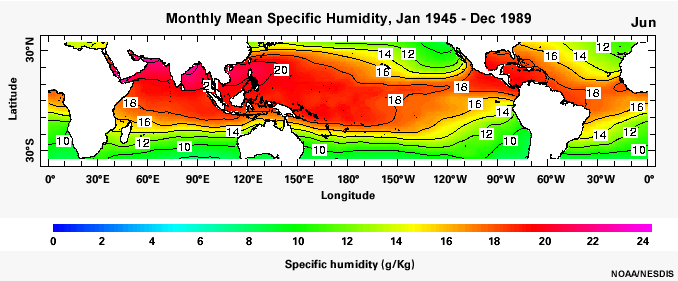
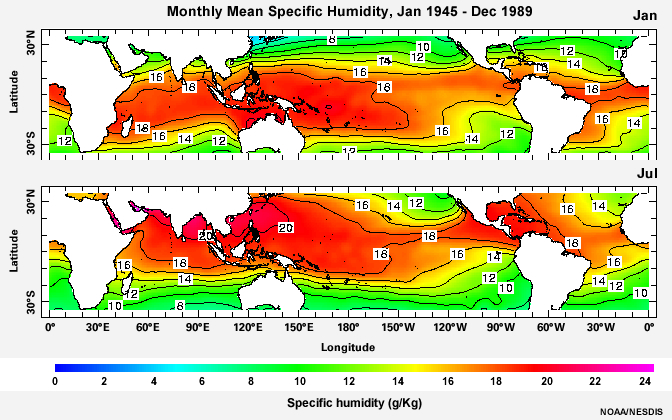
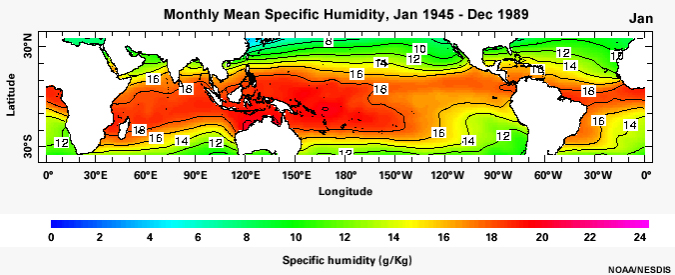
Monthly mean specific humidity for the period January 1945 to December 1989
|
|

credits:
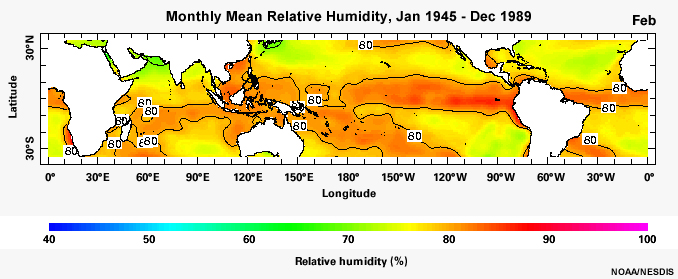
NOAA/NESDIS
copyright terms:
COMET Standard Terms of Use
description:
Static image of monthly mean relative humidity for the period January 1945 to December 1989
|
|
credits:
NOAA/NESDIS
copyright terms:
COMET Standard Terms of Use
description:
Static image of monthly mean specific humidity for the period January 1945 to December 1989
|
credits:
NASA (Adapted from Myneni et al. 2007)
copyright terms:
COMET Standard Terms of Use
description:
Time series of monthly LAI from the Terra MODIS instrument, monthly maximum of hourly average surface solar radiation from the Terra Clouds and the Earth's Radiant Energy System (CERES) and Geostationary Operational Environmental Satellite 8 (GOES-8) instruments, and monthly merged precipitation from the Tropical Rainfall Measuring Mission (TRMM) and other sources.
|
|
credits:
©The COMET Program
copyright terms:
COMET Standard Terms of Use
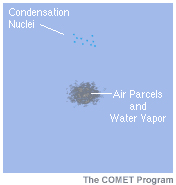
description:
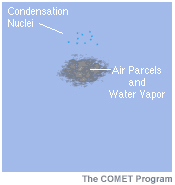
Static image of conceptual model of cloud formation by heterogeneous nucleation
|
credits:
Bjorn Stevens
copyright terms:
COMET Standard Terms of Use
description:
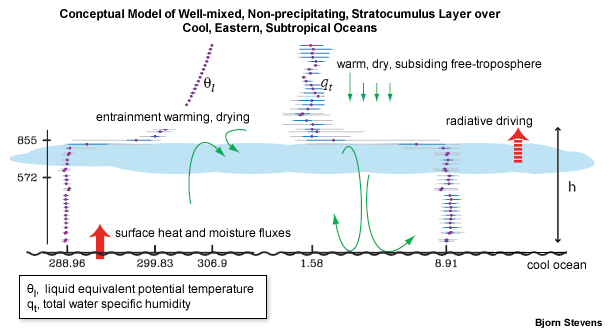
Cartoon of well-mixed, non-precipitating, stratocumulus layer, overlaid with data from research flight near 30˚N, 120˚W. Plotted are the full range, middle quartile, and mean of liquid equivalent potential temperature, θl , specific humidity, qt , and ql from all the data over the target region. Heights of cloud base and top are indicated on the left. (Courtesy of Dr. Bjorn Stevens)
|
|
credits:
NCEP/NCAR
copyright terms:
COMET Standard Terms of Use
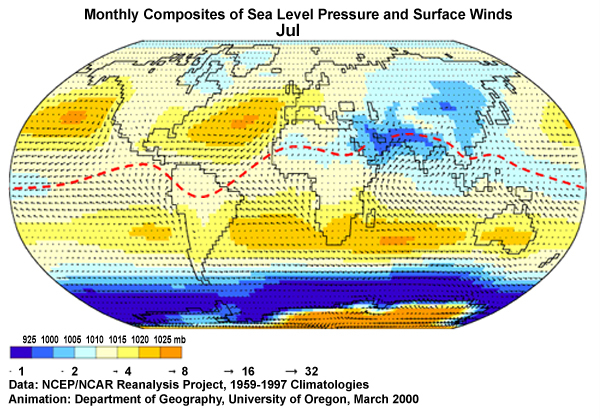
description:
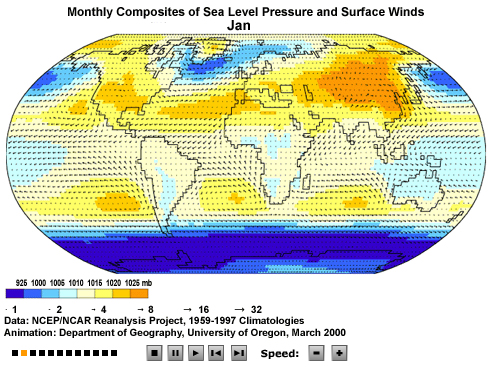
Monthly composites of sea-level pressure and surface winds for July. The red dashed line represents convergence zones.
|
credits:
NCEP/NCAR
copyright terms:
COMET Standard Terms of Use
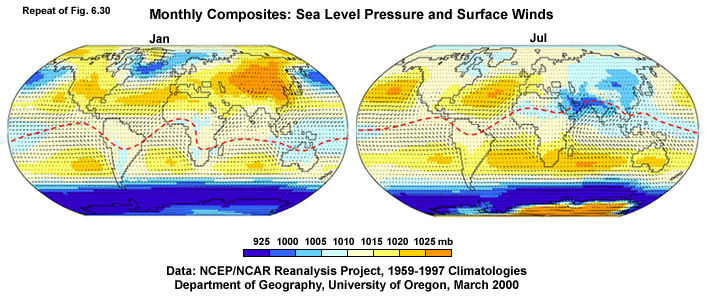
description:
Monthly composites of sea-level pressure and surface winds for July. The red dashed line represents convergence zones.
|
credits:
NOAA/CDC
copyright terms:
COMET Standard Terms of Use
description:
Mean annual potential evaporation (Wm-2) for January 1948 to December 2006 (NCEP-NCAR Reanalysis)
|
|
|
credits:
©The COMET Program
copyright terms:
COMET Standard Terms of Use
description:
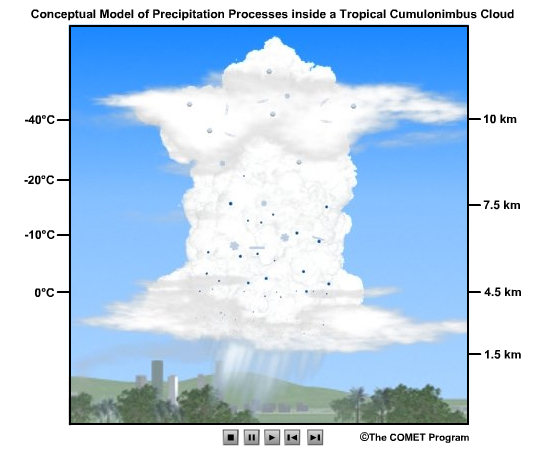
Static image for animation of precipitation processes in a cumulonimbus over land
|
credits:
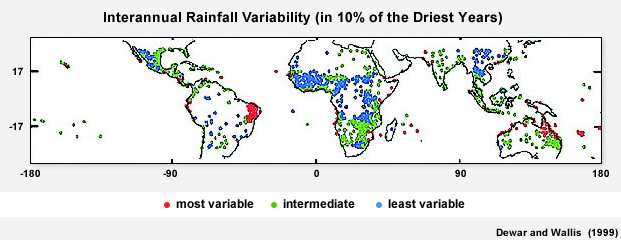
Dewars et al. (1999)
copyright terms:
COMET Standard Terms of Use
description:
Variations in the 0.1 quantile. Red dots are stations from the most variable regions, green are stations from the middle 50% of regions, and blue are stations from the least variable regions. Data is from the GHCN after 1940 (adapted from Dewars et al78)
|
credits:
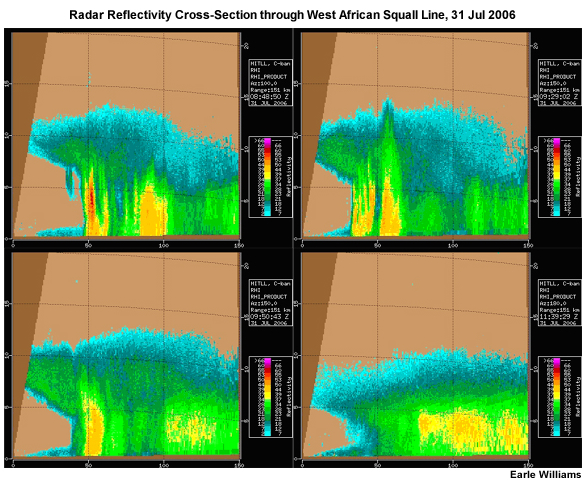
Earle Williams
copyright terms:
COMET Standard Terms of Use
description:
Radar Reflectivity Cross-Section through West African Squall Line
|
credits:
Earle Williams
copyright terms:
COMET Standard Terms of Use
description:
Radar Reflectivity Cross-Section through West African Squall Line
|
credits:
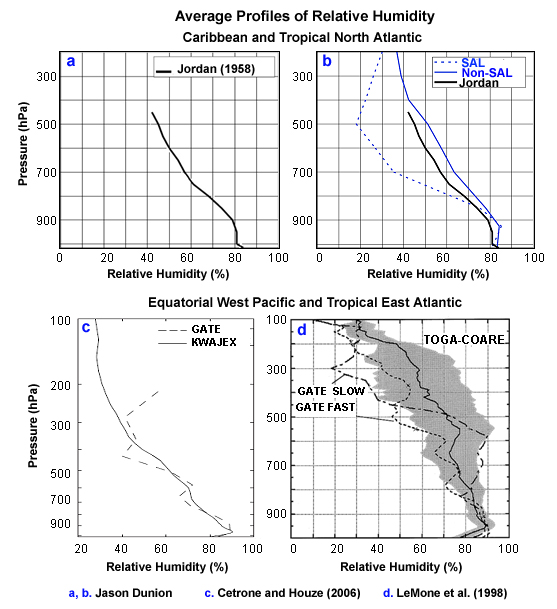
Jason Dunion, Cetrone and House (2006), LeMone et al (1998)
copyright terms:
COMET Standard Terms of Use
description:
(a) the West Indies for Jul-Oct based on soundings from Jordan29; (b) the Caribbean and tropical north Atlantic, Jul-Oct 2002, from Dunion and Marron31; (c) all GATE and KWAJEX soundings from Cetrone and Houze33; and (d) the tropical east Atlantic for GATE convective bands (?slow lines?), and squall lines (?fast lines?) and deep convective environments in the western tropical Pacific during TOGA COARE, from LeMone et al32. For (d) GATE data are from Barnes and Sieckman28, and area shaded is within one standard deviation. The map shows the sounding locations and annual evaporation rate.
|
credits:
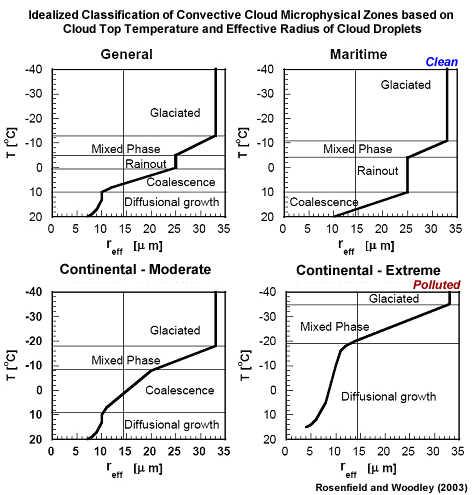
Rosenfield and Woodley (2003)
copyright terms:
COMET Standard Terms of Use
description:
Idealized classification of convective clouds into microphysical zones according to the relationship of cloud top temperature (T,ºC) and effective radius, reff, of cloud droplets
|
credits:
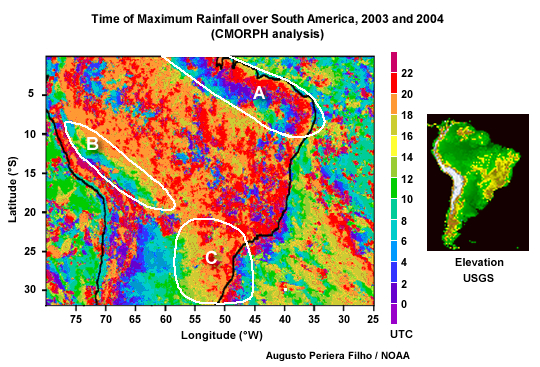
Augusto Periera Filho / NOAA
copyright terms:
COMET Standard Terms of Use
description:
Time of Maximum Rainfall over South America for 2003 and 2004 (based on CMORPH analysis)
|
credits:
©The COMET Program
copyright terms:
COMET Standard Terms of Use
description:
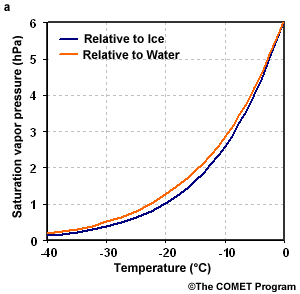
Saturation vapor pressure over water and ice as a function of temperature
|
credits:
©The COMET Program
copyright terms:
COMET Standard Terms of Use
description:
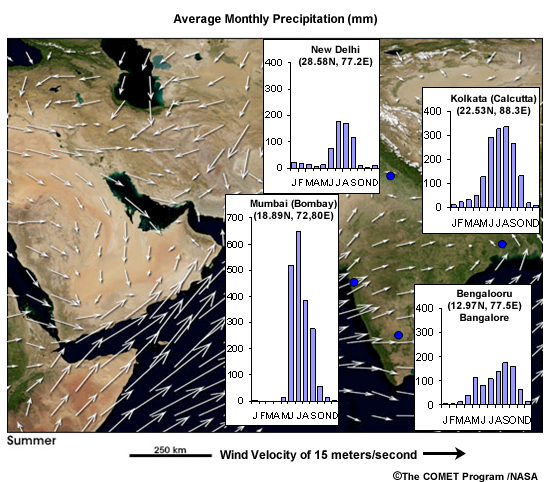
Average monthly precipitation (mm) for stations in the Indian subcontinent
|
credits:
©The COMET Program
copyright terms:
COMET Standard Terms of Use
description:
Average monthly precipitation (mm) for stations in Central Africa
|
credits:
©The COMET Program
copyright terms:
COMET Standard Terms of Use
description:
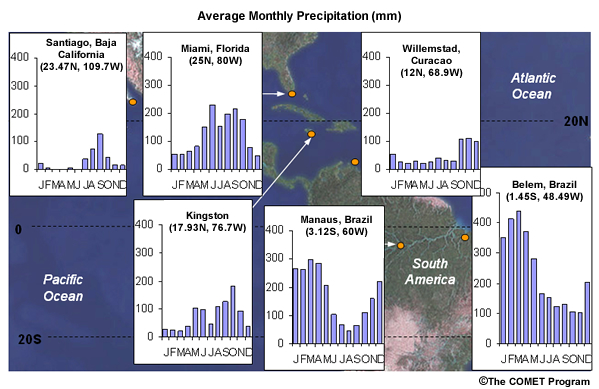
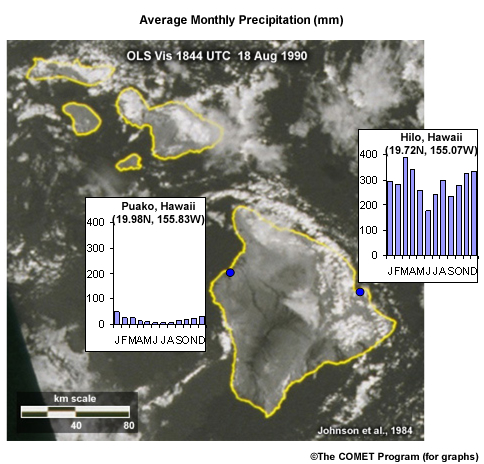
Average monthly precipitation (mm) for stations in Hawaii
|
credits:
©The COMET Program /NASA
copyright terms:
COMET Standard Terms of Use
description:
Average monthly precipitation (mm) for stations in the Indian subcontinent
|
credits:
©The COMET Program
copyright terms:
COMET Standard Terms of Use
description:
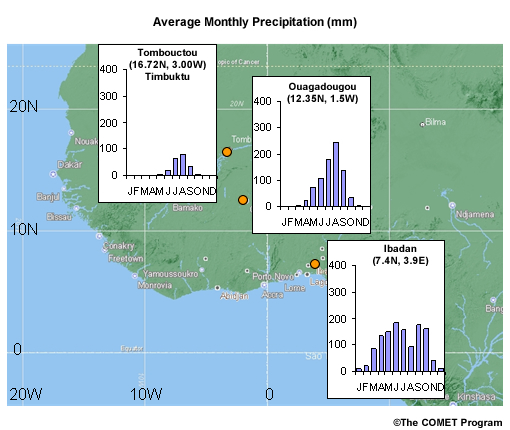
Average monthly precipitation (mm) for stations in West Africa
|
|
|
credits:
©The COMET Program / NOAA
copyright terms:
COMET Standard Terms of Use
description:
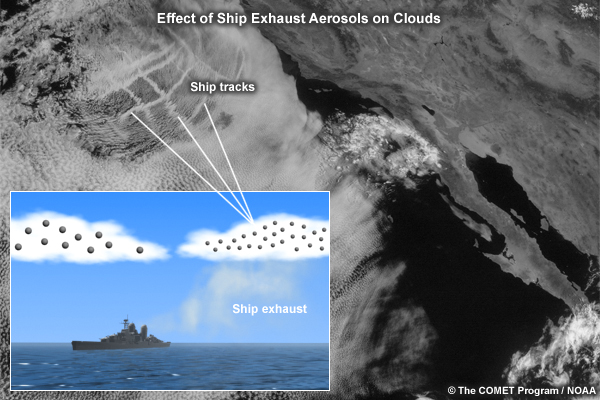
Conceptual model of the effect of ship exhaust aerosols on cloud microphysics
|
|
credits:
©The COMET Program
copyright terms:
COMET Standard Terms of Use
description:
Static image of conceptual model of tropical squall line cross-sections as the squall line moves from east to west
|
credits:
©The COMET Program
copyright terms:
COMET Standard Terms of Use
description:
The curve separating the blue and the green represents saturation as derived from the Clausius-Clapeyron equation (1) for saturation with respect to water. The yellow line illustrates how saturation can result from the isobaric mixing of air parcels with different temperature and moisture properties. The state of all possible mixtures of parcels A and B lie (approximately) along the yellow line. Parcel AB represents the supersaturated parcel that results from mixing equal masses of the original parcels.
|
credits:
NASA (Adapted from Wenhong Li)
copyright terms:
COMET Standard Terms of Use
description:
January and July prevailing winds and TRMM rainfall over South America
|
credits:
©The COMET Program
copyright terms:
COMET Standard Terms of Use
description:
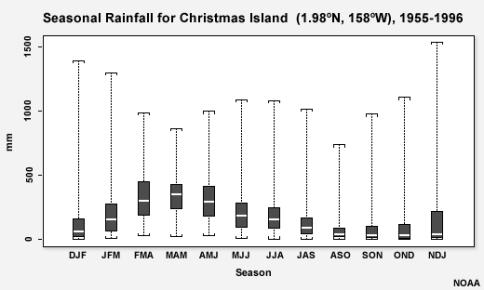
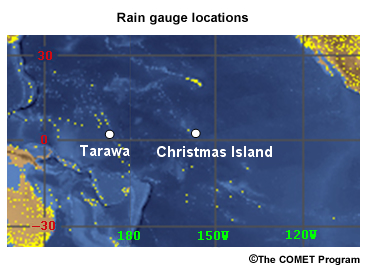
Geographic location of Tarawa and Christmas Island, similar latitude but contrasting seasonal precipitation
|
|
credits:
Ooyama (1969), Jason Dunion, Cetrone and House (2006), LeMone et al (1998), Data from Grossman and D
copyright terms:
COMET Standard Terms of Use
description:
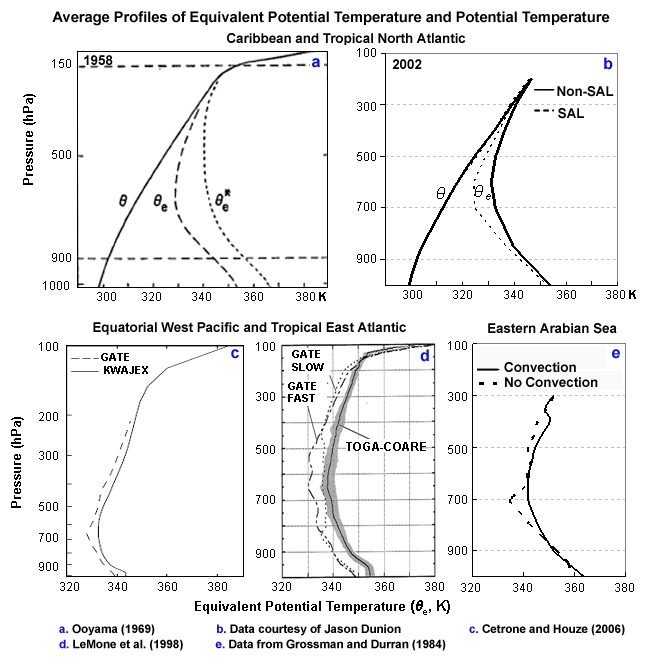
Similar to 6.20 except for average profiles of potential temperature, θ, and equivalent potential temperature, θe, in (a) and (b) and average profiles of θe in (c), (d), and (e). (a) is from Ooyama30 using data from Jordan29; (e) is based on data from the Summer Monsoon Experiment compiled by Grossman and Durran34.
|
credits:
Aspliden (1976)
copyright terms:
COMET Standard Terms of Use
description:
Distribution of tropospheric static energy according to modes expressed in equivalent potential temperature, e, during August 1968 at Seawell airport in Barbados (Aspliden30)
|
credits:
Lucas and Zipser (2000)
copyright terms:
COMET Standard Terms of Use
description:
Equivalent potential temperature difference between active and fair weather periods.
|
credits:
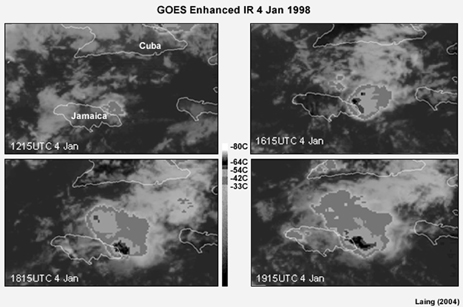
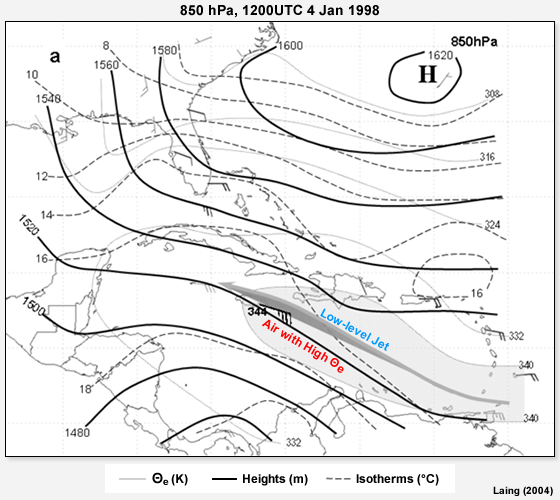
Laing (2004)
copyright terms:
COMET Standard Terms of Use
description:
Equivalent potential temperature, θe(K), geopotential height (m), temperature (°C) at 850 hPa, 1200UTC 4 Jan 1998. Contours of θe are thin, light grey and areas with θe greater than 340K are shaded, heights are solid black, and isotherms are dashed. The thick arrow in (a) depicts a low-level jet.
|
credits:
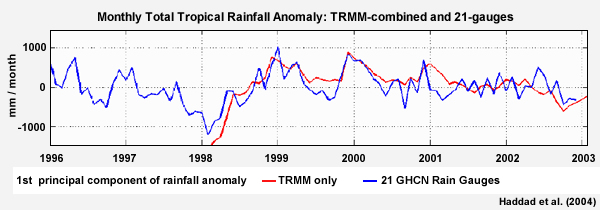
Haddad et al. (2004)
copyright terms:
COMET Standard Terms of Use
description:
Time series of TRMM-combined anomaly principal component. Red line is TRMM only and blue line is from 21 gauges in the GHCN (from Haddad et al 2004)
|
credits:
Schumacher and Houze (2003)
copyright terms:
COMET Standard Terms of Use
description:
The distribution of (a) stratiform, (b) deep convective, and(c) shallow convective precipitation derived from TRMM PR measurements (Schumacher and Houze 2003)
|
credits:
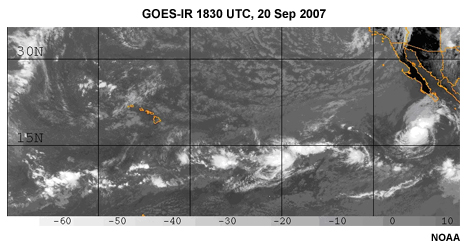
NOAA
copyright terms:
COMET Standard Terms of Use
description:
IR satellite image of the tropical, north Pacific at 1830 UTC, 20 Sep. 2007. Note the vast area covered primarily by shallow, trade cumuli (light grey in the IR image). ITCZ cloud systems (bright white in both images) are taller and organized into mesoscale clusters.
|
credits:
NOAA
copyright terms:
COMET Standard Terms of Use
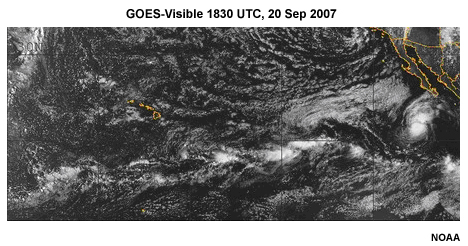
description:
Visible satellite image of the tropical, north Pacific at 1830 UTC, 20 Sep. 2007. Note the vast area covered primarily by shallow, trade cumuli (light grey in the IR image). ITCZ cloud systems (bright white in both images) are taller and organized into mesoscale clusters.
|
credits:
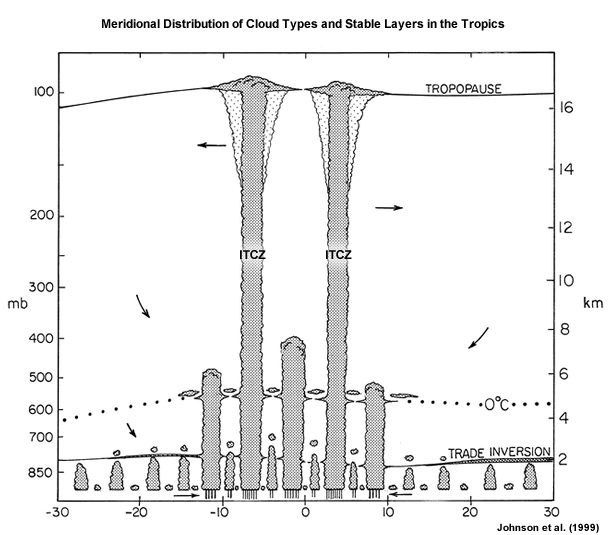
Johnson et al. (1999)
copyright terms:
COMET Standard Terms of Use
description:
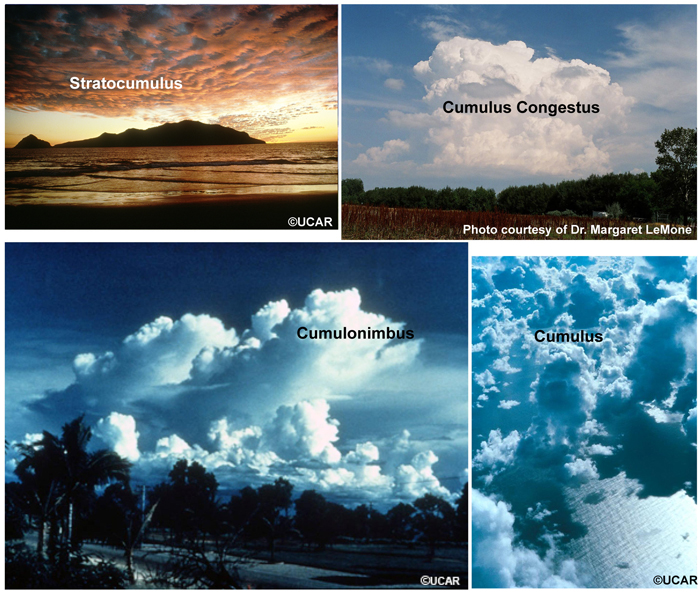
Tropical cloud types are indicated: shallow cumulus, cumulus congestus, and cumulonimbus Three stable layers are indicated: the trade inversion, the 0°C layer, and the tropopause
|
credits:
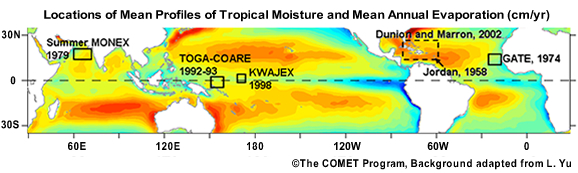
©The COMET Program, Background adapted from L. Yu
copyright terms:
COMET Standard Terms of Use
description:
Locations from which the mean profiles of tropical moisture were taken
|
|
|
|
|
credits:
©The COMET Program
copyright terms:
COMET Standard Terms of Use
description:
Cross section of mature updraft and downdraft in squall line with precipitation
|
credits:
©The COMET Program
copyright terms:
COMET Standard Terms of Use
description:
Cross section of MCS gust front initiating new updraft
|
credits:
©The COMET Program
copyright terms:
COMET Standard Terms of Use
description:
Cross section of expanding gust front from an MCS with new updraft
|
credits:
©The COMET Program
copyright terms:
COMET Standard Terms of Use
description:
Cross section of second cell pulse in MCS evolution
|
credits:
©The COMET Program
copyright terms:
COMET Standard Terms of Use
description:
Cross section of mature MCS evolution with trailing stratiform precipitation
|
credits:
©The COMET Program
copyright terms:
COMET Standard Terms of Use
description:
Cross section of mature MCS evolution with trailing stratiform precipitation
|
credits:
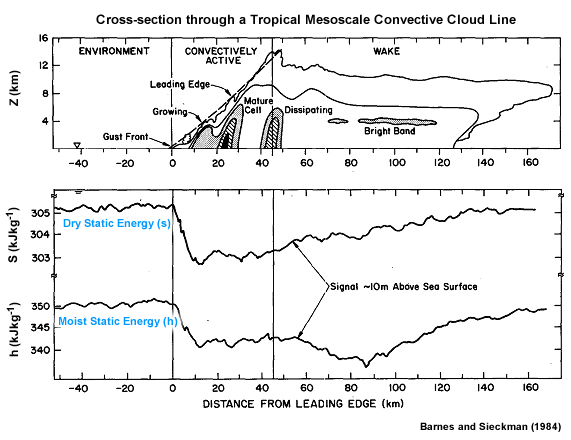
Barnes and Sieckman (1984)
copyright terms:
COMET Standard Terms of Use
description:
Schematic of the reflectivity structure normal to the leading edge of a mesoscale convective cloud line. Lower: the signal of dry (s) and moist (h) static energy near the sea surface that is typical of such a system. For a fast-moving squall line, the wake can extend over 300km behind the leading edge (Barnes and Sieckman 1984)
|
credits:
©The COMET Program
copyright terms:
COMET Standard Terms of Use
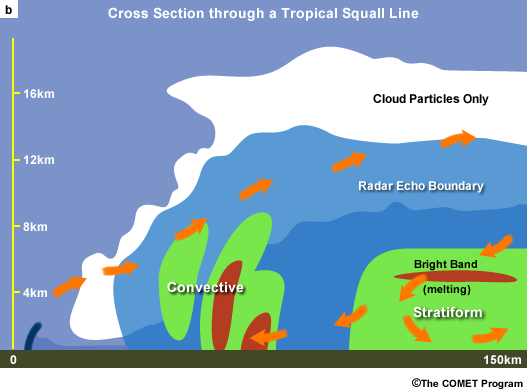
description:
Conceptual model of convective and stratiform precipitation in a tropical squall line
|
credits:
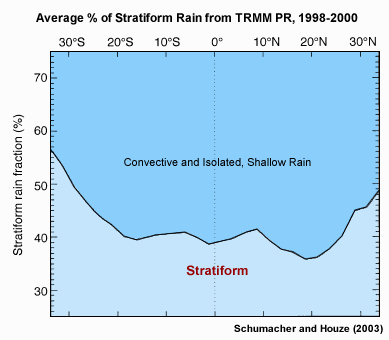
Schumacher and Houze (2003)
copyright terms:
COMET Standard Terms of Use
description:
Annual average stratiform rain fraction from 1998-2000 based on TRMM PR near surface rain rate
|