The following media items used in this module are protected by the details of their copyrights. Please use the "copyright terms" link associated with each media item below for more information.
Click an image to view it at full size in a new browser window/tab.
|
|
credits:
©The COMET Program
copyright terms:
COMET Standard Terms of Use
description:
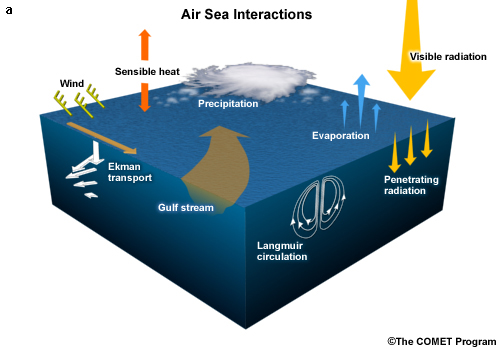
Schematic of general air-sea interactions involving transfer of momentum, heat, moisture, and radiation.
|
|
credits:
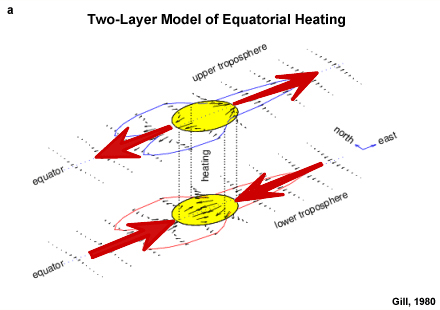
Gill 1980
copyright terms:
COMET Standard Terms of Use
description:
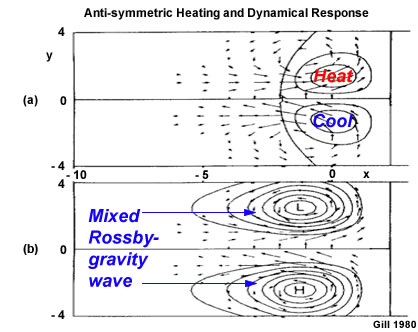
Schematic of response to anti-symmetric heating away off the equator (a) horizontal wind vectors and vertical velocity contours; (b) perturbation pressure contours overlaid on the same wind vectors. A dominant anti-symmetric mode is a mixed Rossby-gravity wave that moves westward.
|

credits:
NASA
copyright terms:
COMET Standard Terms of Use
description:
MODIS image of sea surface temperature over the Arabian Sea showing cold temperatures along the coast of Oman due to upwelling. 25 May 2003
|
credits:
WMO
copyright terms:
COMET Standard Terms of Use
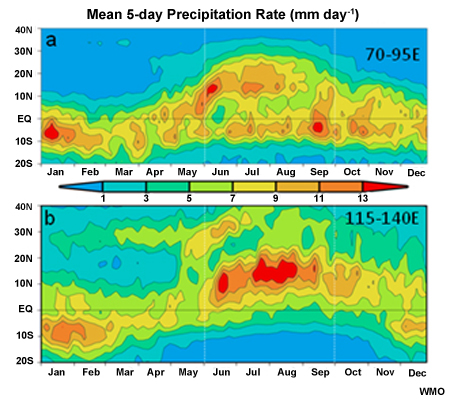
description:
Climatological pentad (5-day) mean precipitation rate (mm/day) averaged over (a) the Indian sector (70°E-95°E) and (b) the western Pacific sector (115°E-140°E). The data used are derived from Xie and Arkin (1996) for the period of 1979-2000. (From Wang et al. 2005 )
|
credits:
Wang and Lin 2002
copyright terms:
COMET Standard Terms of Use
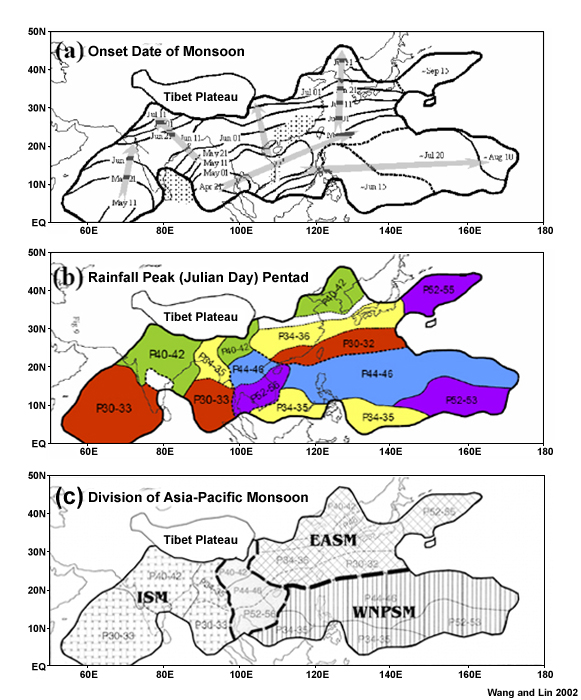
description:
(a) Mean onset date and (b) peak pentad of the Asian summer monsoon rainy season; (c) division of the Asian monsoon (Adapted from Wang and Lin 2002).
|
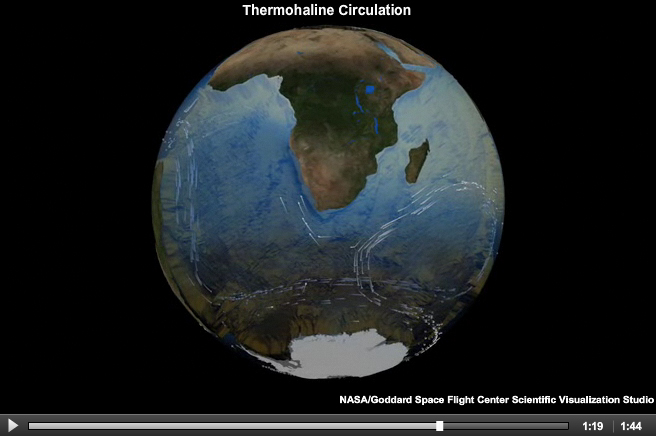
credits:
© The COMET Program
copyright terms:
COMET Standard Terms of Use
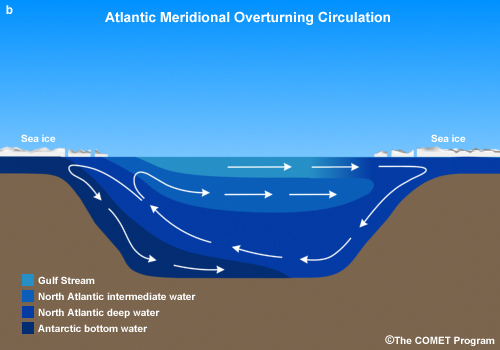
description:
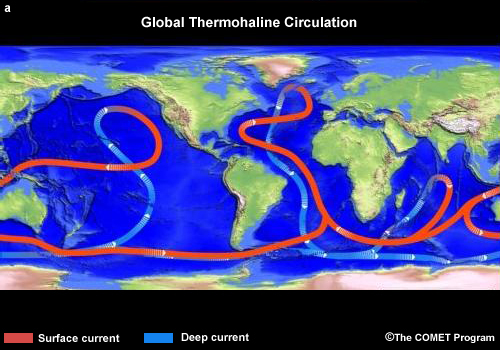
Conceptual image showing thermohaline circulation in the Atlantic Ocean
|
credits:
BOM, Mick Pope
copyright terms:
COMET Standard Terms of Use
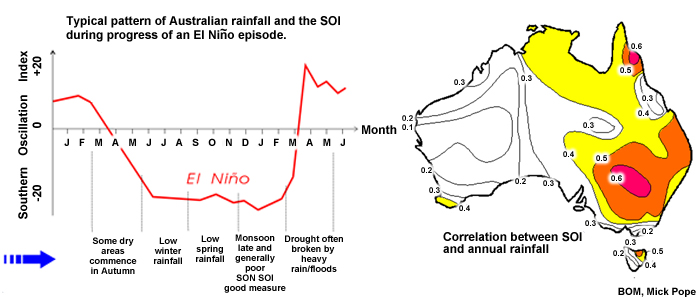
description:
(left) A schematic of the SOI for a typical El Niño, together with the rainfall pattern in the Australian region. (right) Correlation between SOI and annual rainfall for Australia. Darker colors indicate a higher correlation.
|
credits:
WMO
copyright terms:
COMET Standard Terms of Use
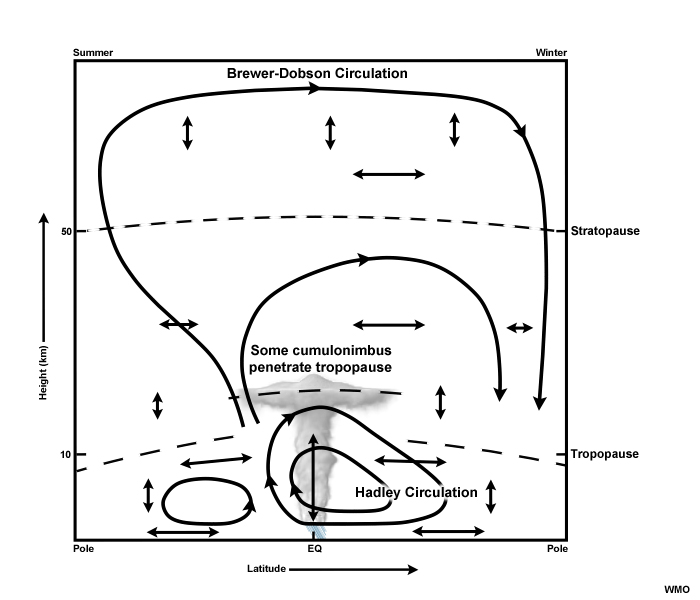
description:
Schematic of mean meridional tropospheric and stratospheric circulation at the solstice (WMO 1985 ). Much of stratospheric air enters through the tropical tropopause.
|
|
credits:
Adapted from Muñoz et al. 2008
copyright terms:
COMET Standard Terms of Use
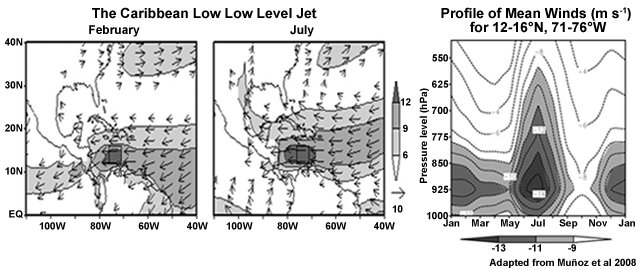
description:
The Caribbean LLJ in February and July and the vertical profile of the zonal winds averaged for the column 71°76°W and 12°16°N (Adapted from Muñoz et al. 2008)
|
credits:
UCAR
copyright terms:
COMET Standard Terms of Use
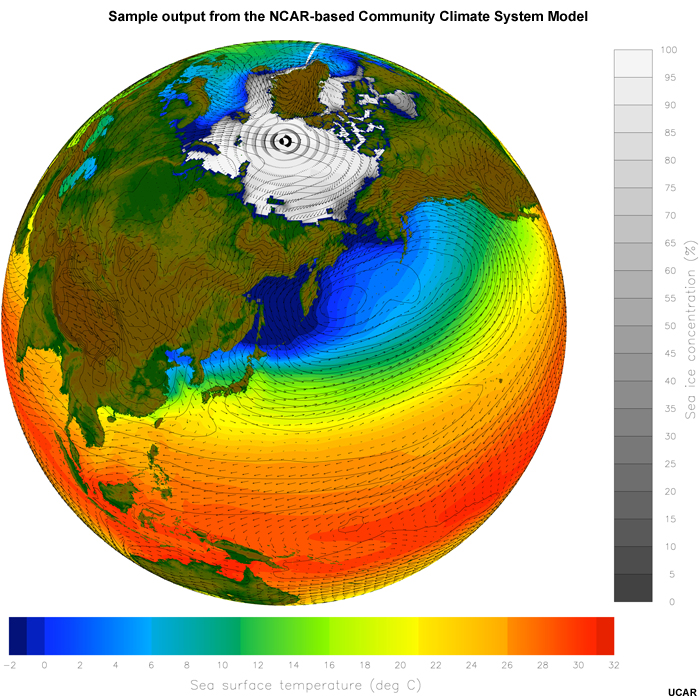
description:
Simulation of the global climate depicts sea surface temperatures and sea ice concentrations, sea level pressure and low-level winds, including warmer air moving north on the eastern side of low-pressure regions and colder air moving south on the western side of the lows. Such simulations, produced by the NCAR-based Community Climate System Model, can also depict additional features of the climate system, such as precipitation.
|
|
credits:
WMO
copyright terms:
COMET Standard Terms of Use
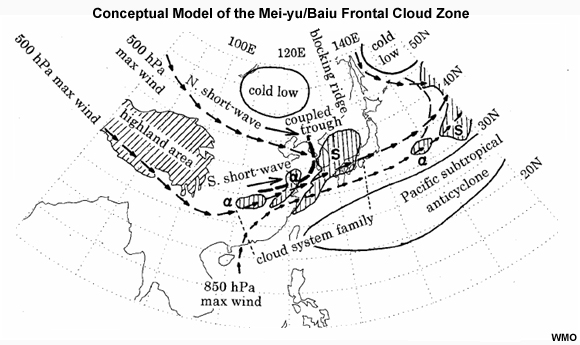
description:
Conceptual model of the Meiyu-Baiu frontal cloud zone (Ninomiya, 2004 ). Note the hatched areas representing a family of cloud systems along the front, the 850 hPa low-level jet, and the mid-tropospheric maximum wind tracks (short-waves develop along this track and enhance instability and ascent).
|
credits:
© The COMET Program
copyright terms:
COMET Standard Terms of Use
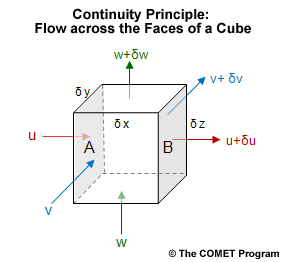
description:
Schematic representation of the continuity principle
|
|
|
credits:
Adapted from Mick Pope
copyright terms:
COMET Standard Terms of Use
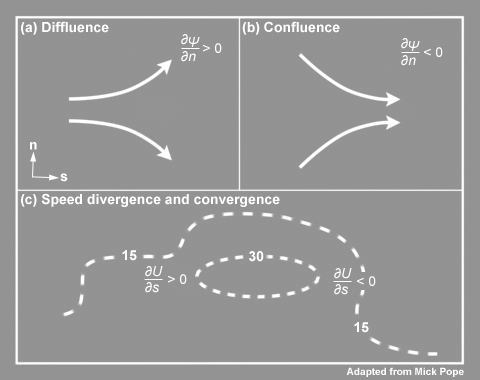
description:
Streamline patterns showing (a) diffluence and (b) confluence. The locations of divergence and convergence relative to a wind speed maximum are shown in (c). The dot is motion out of the page, the cross is the opposite (Courtesy of Mick Pope, BOM).
|
credits:
Chang et al. 2005
copyright terms:
COMET Standard Terms of Use
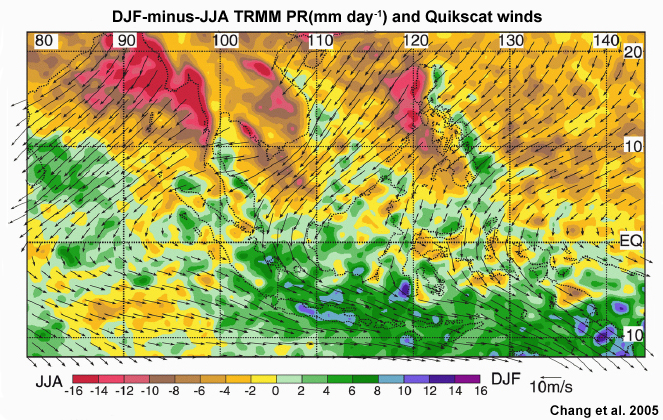
description:
Differences of TRMM PR rainfall and QuikSCAT winds between boreal winter and boreal summer (DJF minus JJA). Warm colors are the boreal summer monsoon regime and cool colors are the boreal winter monsoon regime (Chang et al. 2005)
|
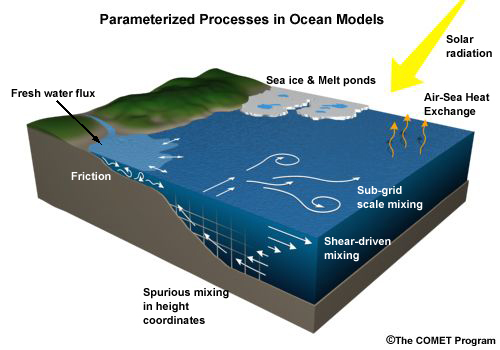
credits:
© The COMET Program
copyright terms:
COMET Standard Terms of Use
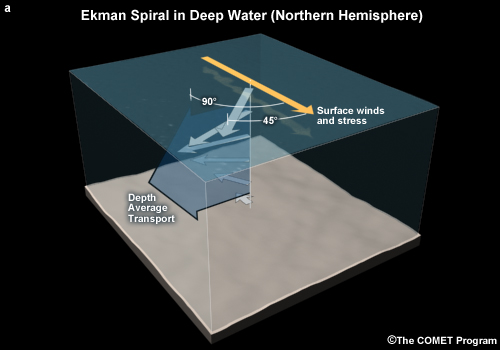
description:
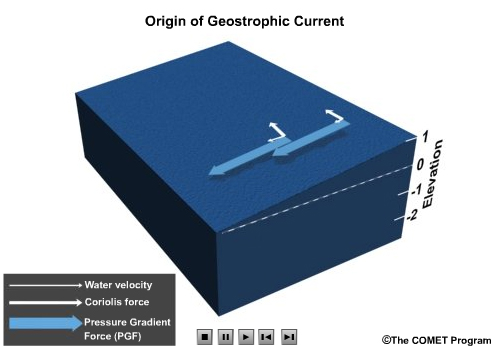
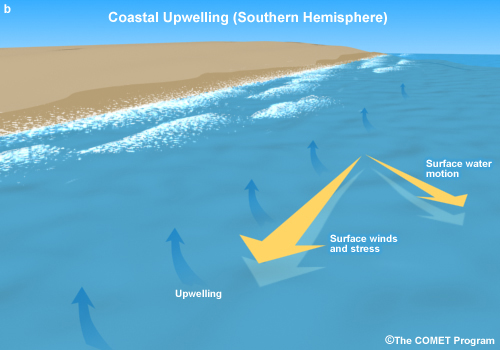
Surface and depth averaged transport currents due to Ekman spiral for deep water. This is often true for deep water but not shallow water.
|
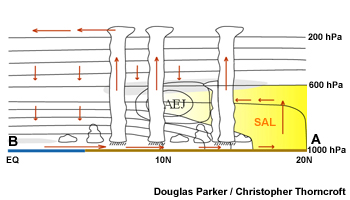
credits:
Douglas Parker / Christopher Thorncroft
copyright terms:
COMET Standard Terms of Use
description:
Schematic of N-S vertical cross section along the Greenwich Meridian highlighting the heat low-AEJ-ITCZ system, the SAL (yellow shade), and meridional variations in atmospheric boundary layer (Adapted from Parker et al. 2003).
|
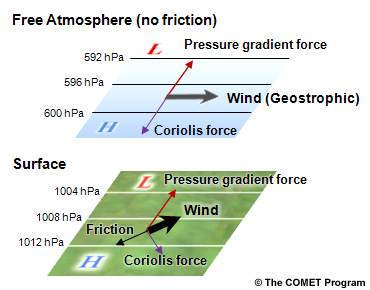
credits:
© The COMET Program
copyright terms:
COMET Standard Terms of Use
description:
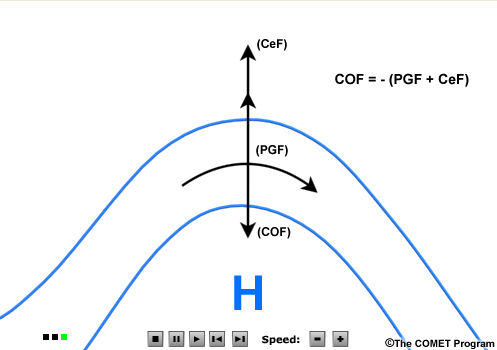
Schematic of horizontal forces acting on air parcels near the surface and above the friction layer.
|
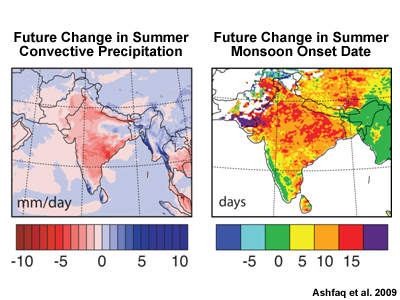
credits:
Ashfaq et al. 2009
copyright terms:
COMET Standard Terms of Use
description:
Projected future changes in South Asian summer precipitation and monsoon onset date. This study found that rising future temperatures could lead to less rain and a delay in the start of monsoon season by up to 15 days by the end of the 21st century (Ashfaq et al. 2009 )
|
|
|
|
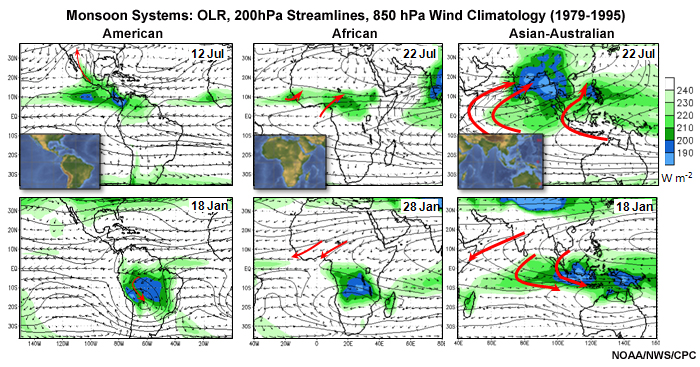
credits:
NOAA/NWS/CPC
copyright terms:
COMET Standard Terms of Use
description:
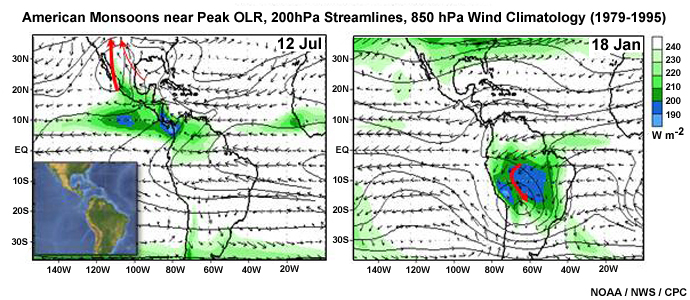
Monsoon Systems: OLR, 200hPa Streamlines, 850 hPa Wind Climatology (1979-1995) for the American, African, and Asian Australian Monsoons. Top panels are peak boreal summer monsoon, Bottom panels are peak austral summer monsoon. Small inset maps are digital elevation.
|
credits:
© The COMET Program
copyright terms:
COMET Standard Terms of Use
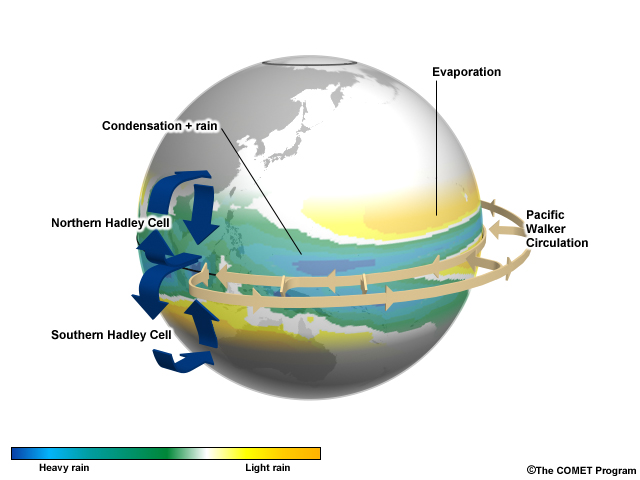
description:
The global ocean conveyor belt showing surface currents and deep currents and the subduction and upwelling zones in between.
|
credits:
© The COMET Program
copyright terms:
COMET Standard Terms of Use
description:
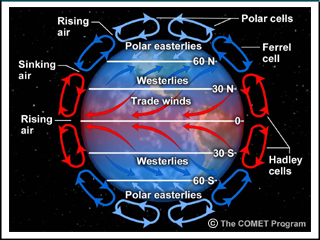
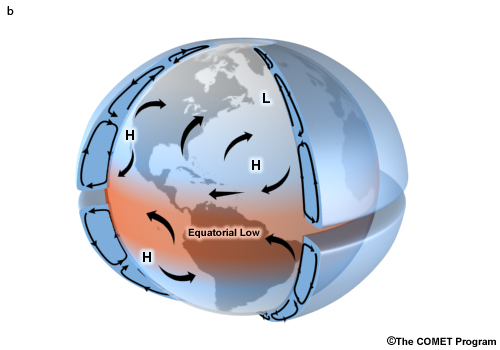
The three-cell circulation model for an aqua planet
|
credits:
© The COMET Program
copyright terms:
COMET Standard Terms of Use
description:
The three-cell circulation model for a planet with continents
|
credits:
© The COMET Program
copyright terms:
COMET Standard Terms of Use
description:
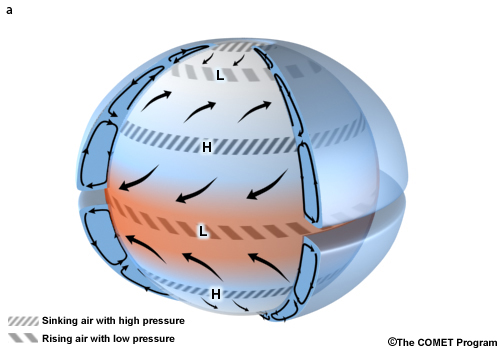
Schematic of an aqua planet with single cell circulation.
|
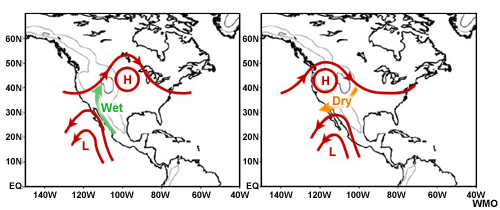
credits:
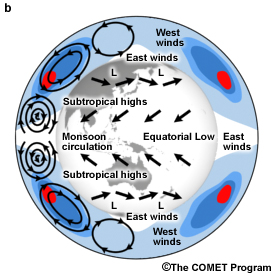
WMO
copyright terms:
COMET Standard Terms of Use
description:
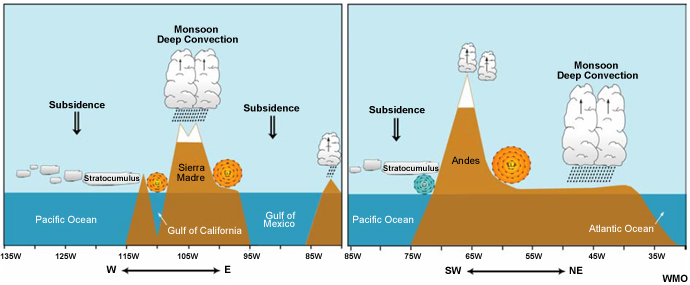
Schematic illustration of the circulation during a dry (left) and wet (dry) surge in the Gulf of California (Wayne Higgins, NOAA)
|
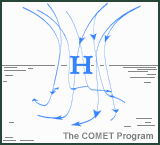
credits:
© The COMET Program
copyright terms:
COMET Standard Terms of Use
description:
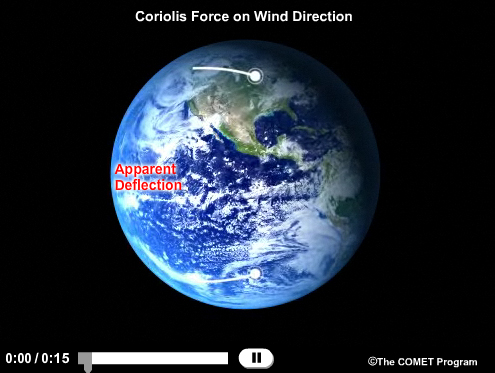
animation showing sinking air and clockwise flow associated with high pressure.
|
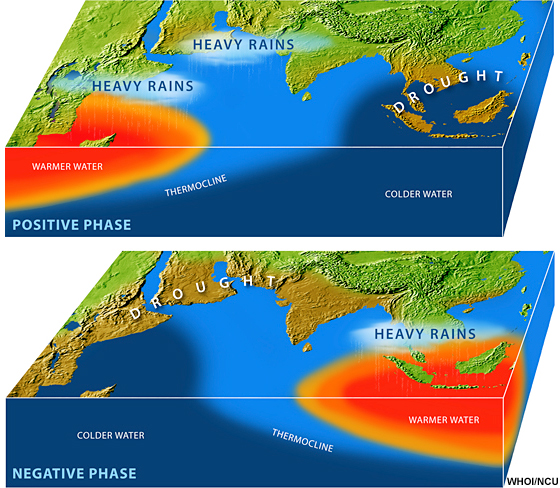
credits:
WHOI / NCU
copyright terms:
COMET Standard Terms of Use
description:
Schematic of the positive and negative phases of the Indian Ocean Dipole
|
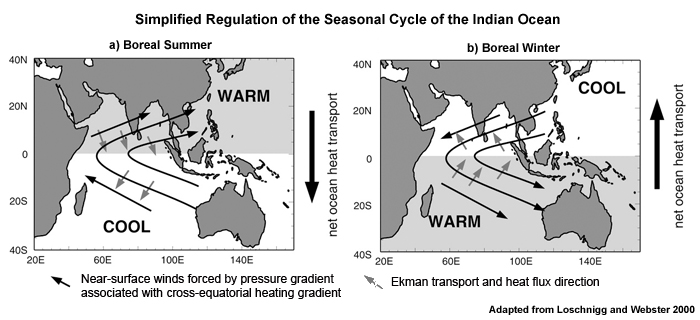
credits:
Adapted from Loschnigg and Webster 2000
copyright terms:
COMET Standard Terms of Use
description:
Schematic of regulation of the seasonal cycle of the Indian Ocean for (a) the boreal summer (June- September) and (b) the boreal winter (December-February). Curved solid lines indicate near-surface winds forced by the large-scale pressure gradient associated with the cross-equatorial heating gradient denoted by warm and cool. Small grey arrows denote Ekman transport and the direction of the associated heat flux.
|
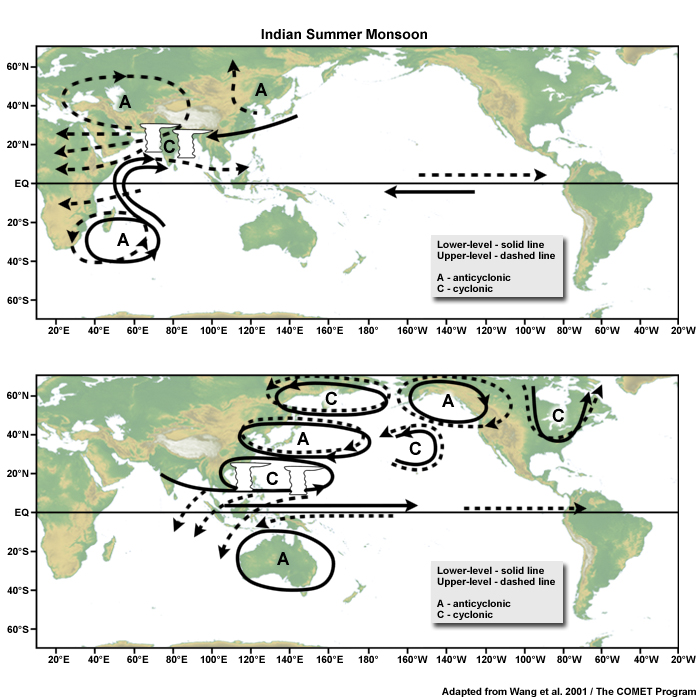
credits:
Adapted from Wang et al. 2001
copyright terms:
COMET Standard Terms of Use
description:
Schematic diagrams showing the major circulation anomalies associated with a strong Indian summer monsoon (a) and a strong western North Pacific summer monsoon (b). The lower-level and upper-level circulation anomalies are denoted by solid and dashed line, respectively. Letter ?A? and ?C? represent anticyclone and cyclone respectively.
|
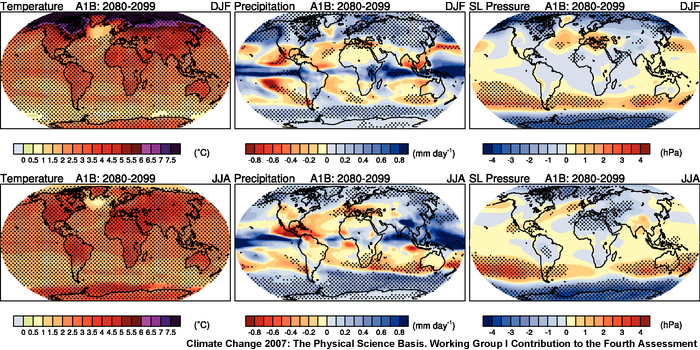
credits:
Climate Change 2007: The Physical Science Basis. Working Group I Contribution to the Fourth Assessme
copyright terms:
COMET Standard Terms of Use
description:
Multi-model mean changes in surface air temperature (°C, left), precipitation (mm day?1, middle) and sea level pressure (hPa, right) for boreal winter (DJF, top) and summer (JJA, bottom). Changes are given for the IPCC A1B scenario, for the period 2080 to 2099 relative to 1980 to 1999. Stippling denotes areas where the magnitude of the multi-model ensemble mean exceeds the inter-model standard deviation
|
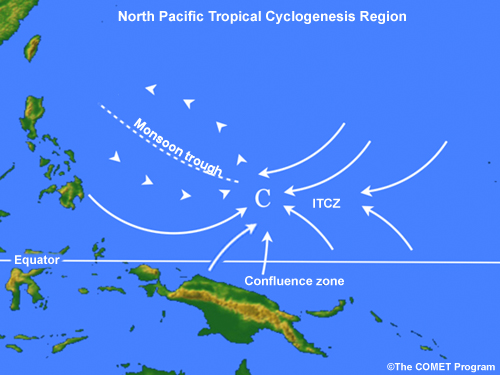
credits:
© The COMET Program
copyright terms:
COMET Standard Terms of Use
description:
Schematic of the western North Pacific tropical cyclogenesis region partitioned into a monsoon trough zone and the near-equatorial ITCZ, meeting at a confluence zone (following Briegel and Frank 1997).
|
|
credits:
© The COMET Program
copyright terms:
COMET Standard Terms of Use
description:
animation showing rising air and counter-clockwise flow associated with low pressure.
|
credits:
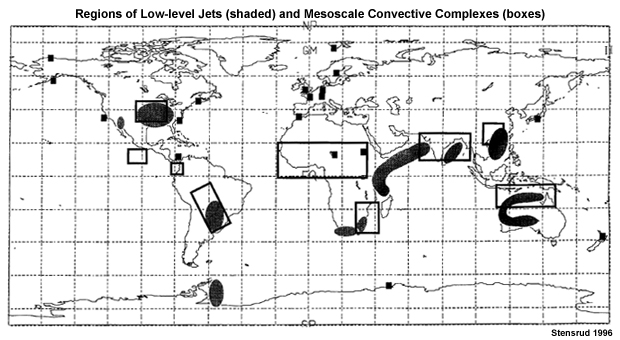
Stensrud 1996
copyright terms:
COMET Standard Terms of Use
description:
Regions of LLJs and frequent occurrence of mesoscale convective systems (from Stensrud 1996).
|

credits:
NCAR / The COMET Program
copyright terms:
COMET Standard Terms of Use
description:
Schematic of the major circulations of the Indian Ocean, the planetary Hadley cell, the tropical easterly jet, and the Asian summer monsoon.
|
credits:
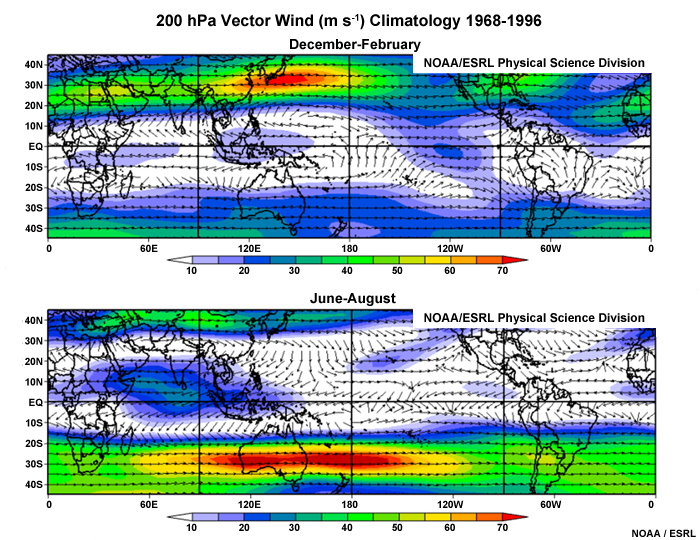
NOAA / ESRL
copyright terms:
COMET Standard Terms of Use
description:
Mean wind vectors at 200 hPa in December-February (upper) and June- August (lower). Note stronger jetstreams in the winter hemisphere (magenta > 60 m s-1).
|
credits:
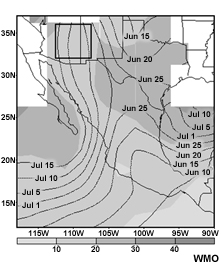
WMO
copyright terms:
COMET Standard Terms of Use
description:
Mean North American Monsoon onset date based on 5-day satellite estimated rainfall from Janowiak and Xie (2003). The shading represents the standard deviation of the onset dates in days.
|
credits:
© The COMET Program
copyright terms:
COMET Standard Terms of Use
description:
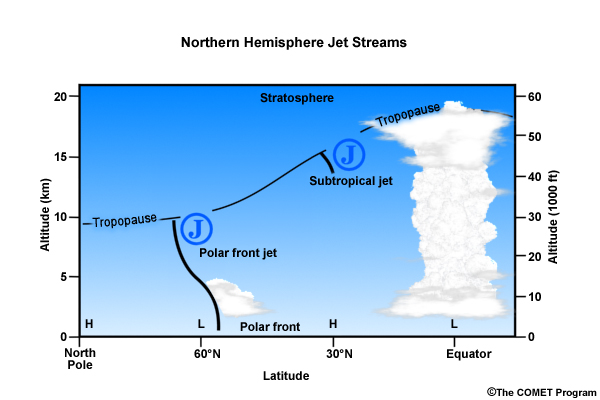
Schematics of the mean meridional circulations and the jet streams
|
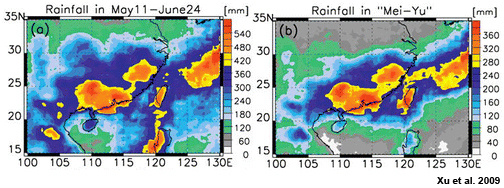
credits:
Xu et al. 2009
copyright terms:
COMET Standard Terms of Use
description:
Mean annual cycle of surface pressure over India (20N) and south Indian Ocean (20S).
|
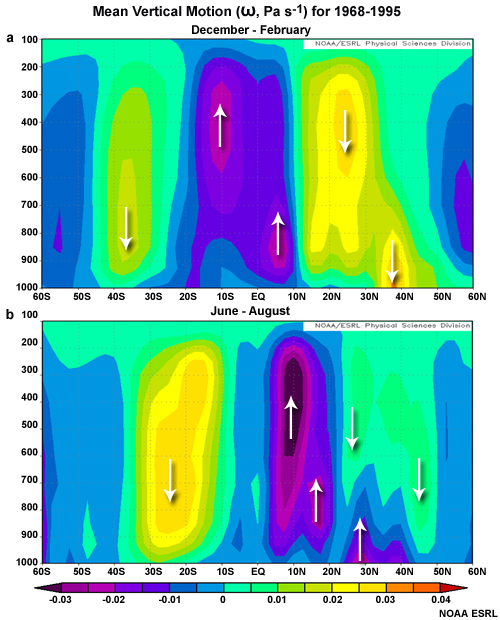
credits:
NOAA ESRL
copyright terms:
COMET Standard Terms of Use
description:
Mean vertical motion (omega, Pascal per second) for (a) Dec-Feb and (b) Jun - Aug for 1968-1995 (from NCEP Climate Atlas)
|
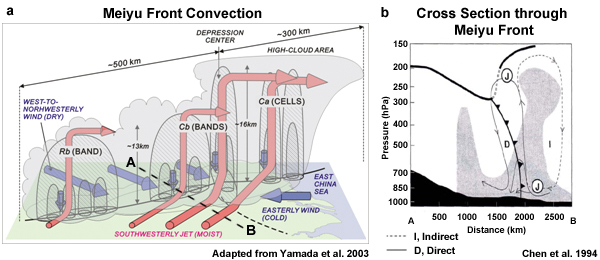
credits:
Chen et al. 1994 (b panel only -- a should already be credited)
copyright terms:
COMET Standard Terms of Use
description:
Schematic diagram showing the flow structure of an observed Meiyu front (from Y. L. Chen et al. 1994). The thin solid line depicts the direct (D) circulation while the thin dashed line depicts the indirect (I) circulation. The heavy solid line shows the frontal position. The character J denotes the jet positions. The thick heavy line represents the tropopause boundary. Regions with relative humidity greater than 70% are shaded.
|
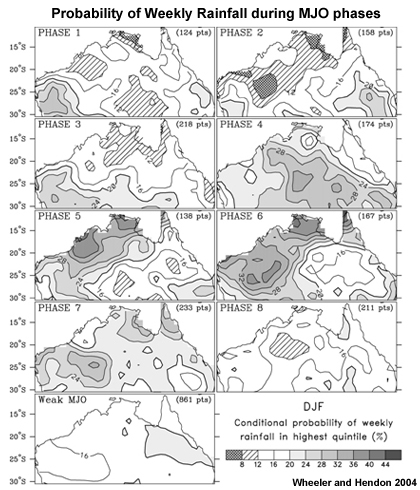
credits:
Wheeler and Hendon 2004
copyright terms:
COMET Standard Terms of Use
description:
Probability of weekly rainfall in highest quintile conditioned upon the phase of the MJO described by the daily values of the Real-time Multivariate MJO (RMM) series. The rainfall weeks are centered on the day upon which the RMM phase is determined. The probabilities are computed for overlapping weeks in the DJF season for 1974?99. (From Wheeler and Hendon 2004 )
|
credits:
WMO
copyright terms:
COMET Standard Terms of Use
description:
Schematic vertical section for the corresponding summer season east-west at about 30N across the NAM (left panel) and southwest-northeast across SAM region. Regions of deep convection and low-level jets are indicated (Panel for NAMS adapted from W. Higgins)
|
credits:
Tanaka 1994
copyright terms:
COMET Standard Terms of Use
description:
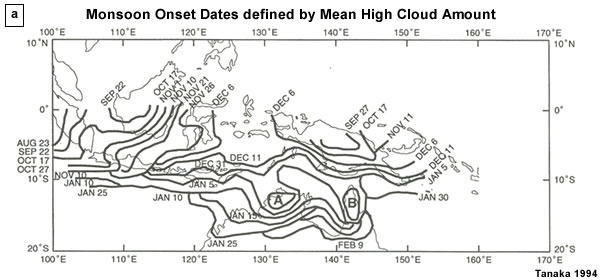
Monsoon onset dates defined by the threshold value of more than 30% of the mean high cloud amount for the monsoon season. Regions A and B had onset prior to 15 December and 26 December, respectively.
|
credits:
Wu 2002
copyright terms:
COMET Standard Terms of Use
description:
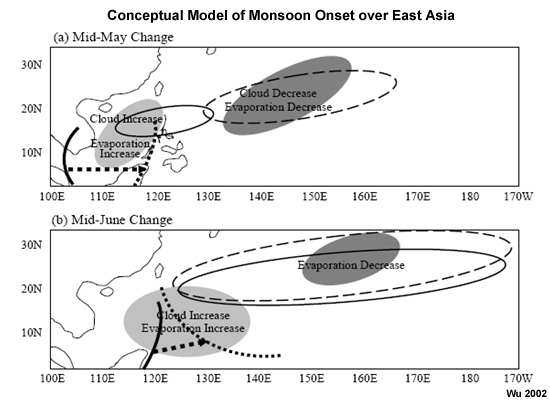
Conceptual model of the (a) mid-May and (b) mid-June monsoon onset over East Asia. Closed solid (dashed) curves mark the subtropical high before (after) onset. Light (dark) shades signify an increase (decrease) in clouds and/or evaporation. Dashed arrows show the direction of the extension of low-level westerlies (from Wu 2002).
|
credits:
Cadet 1986, Tellus
copyright terms:
COMET Standard Terms of Use
description:
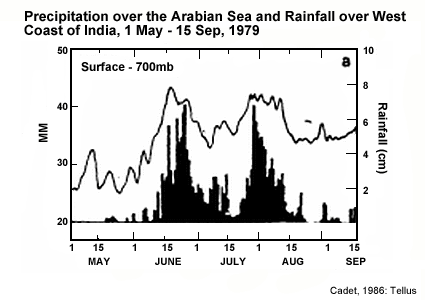
Precipitation and surface to 700 hPa precipitable water over the Arabian Sea and Indian west coast for 1 May to 15 Sep 1979. Notice the reduction (break) then increase (active) in rainfall amounts (Cadet 1986, Tellus).
|
credits:
© The COMET Program
copyright terms:
COMET Standard Terms of Use
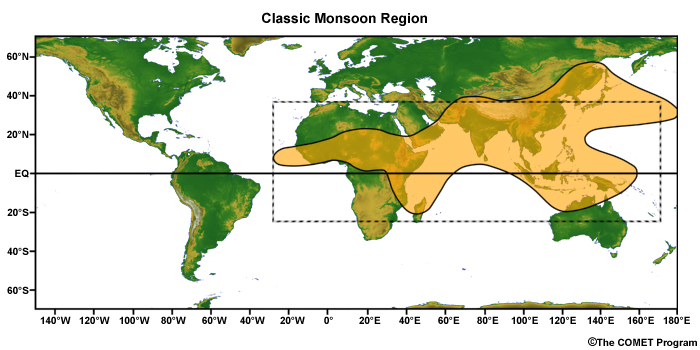
description:
The monsoon regions as defined by Ramage (1971).
|
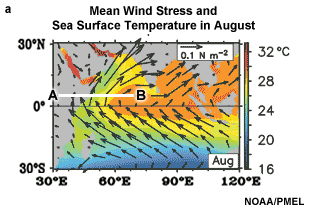
credits:
NOAA/PMEL
copyright terms:
COMET Standard Terms of Use
description:
Mean wind stress at the ocean surface showing the low-level Somali Jet which results from the strong cross equatorial pressure gradient and the high terrain of East Africa.
|
view/save .swf file
credits:
NASA / Goddard Space Flight Center Scientific Visualization Studio
copyright terms:
COMET Standard Terms of Use
description:
NASA's themohaline circulation animation (from NASA / Goddard Space Flight Center Scientific Visualization Studio)
|
|
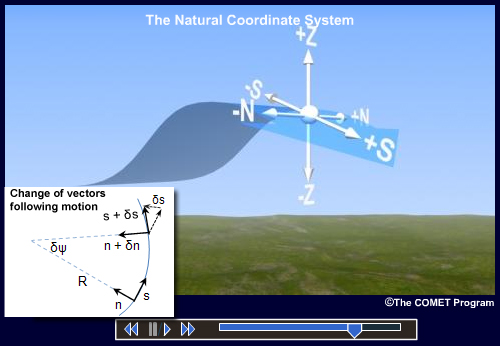
credits:
© The COMET Program
copyright terms:
COMET Standard Terms of Use
description:
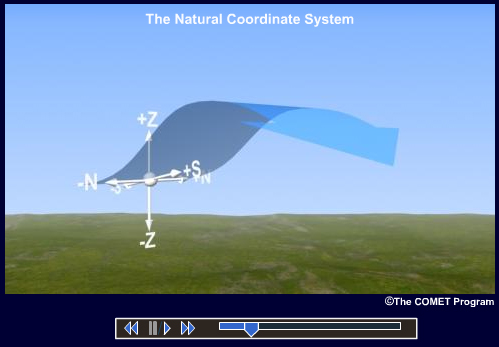
The natural coordinate system with inset of the horizontal natural coordinate system showing the tangent, s, to a fixed curve (streamline), and the normal, n, the radius of curvature R, and angle ?, relative to a fixed direction.
|
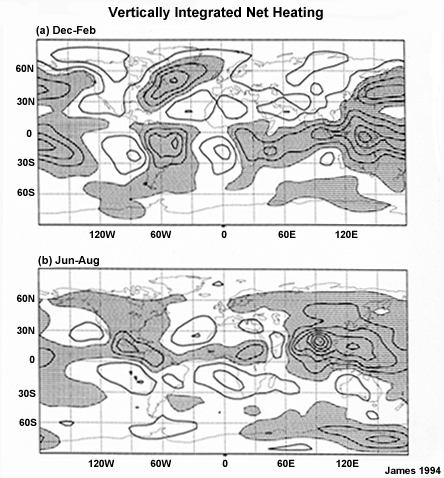
credits:
James 1994
copyright terms:
COMET Standard Terms of Use
description:
Vertically integrated net heating during (a) Dec-Feb and (b) Jun-Aug based on six years of ECMWF data. Contour interval is 50 W m-2; positive values are shaded.
|
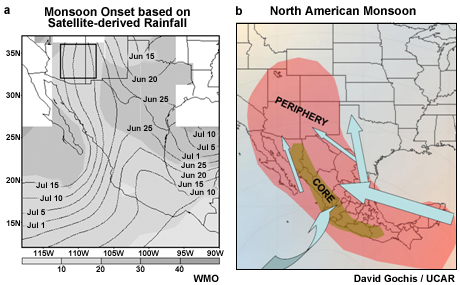
credits:
David Gochis / UCAR
copyright terms:
COMET Standard Terms of Use
description:
Mean North American Monsoon onset date based on 5-day satellite estimated rainfall from Janowiak and Xie (2003). The shading represents the standard deviation of the onset dates in days. (b) Schematic of the NAM system (Dave Gochis, NCAR).
|
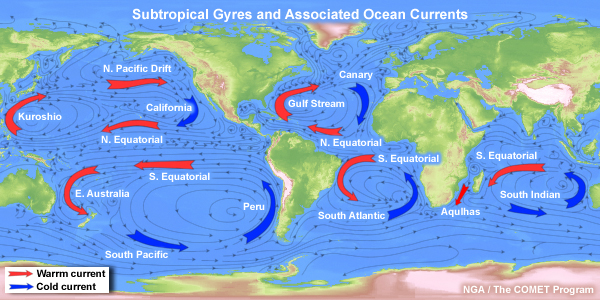
credits:
© The COMET Program
copyright terms:
COMET Standard Terms of Use
description:
Global upper ocean circulations and subtropical gyres; red marks the warm ocean currents and blue marks the cool ocean currents.
|
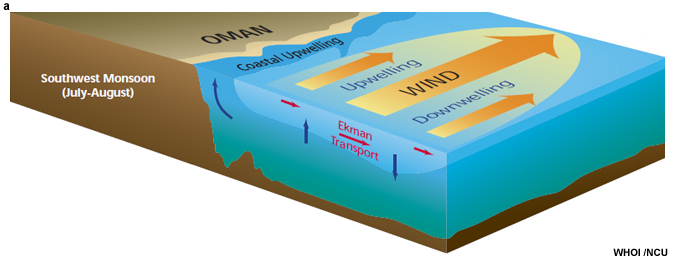
credits:
WHOI / NCU
copyright terms:
COMET Standard Terms of Use
description:
Schematic cross section of the upper ocean dynamical response to the southwesterly monsoon winds and the Arabian Peninsula (Honjo and Weller 1997).
|
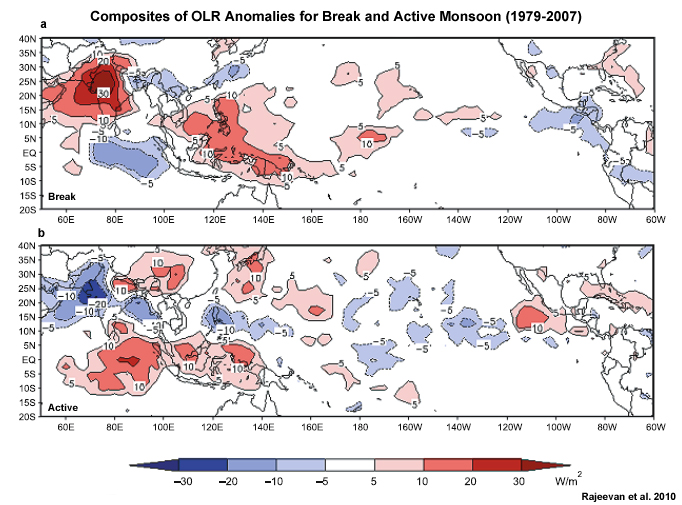
credits:
Rajeevan et al. 2010
copyright terms:
COMET Standard Terms of Use
description:
Composites of OLR anomalies (Wm?2) during (a) break and (b) active spells. Period of analysis: 1979?2007 (From Rajeevan et al. 2010)
|
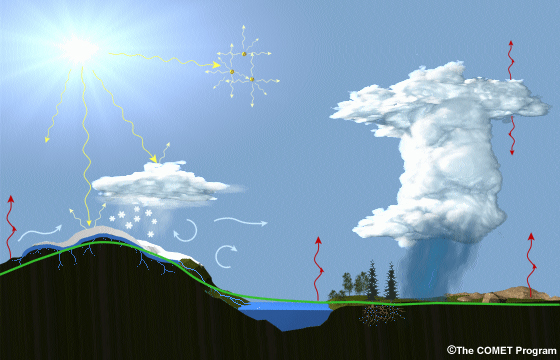
credits:
© The COMET Program
copyright terms:
COMET Standard Terms of Use
description:
Illustration of all processes and physical model elements that are parameterized in numerical weather prediction models. Includes 20 different items, such as topography, deep convection, longwave radiation absorption and emission, microphysical processes, land surface processes and land use types, soil and vegetation processes, snow/water/ice at the earth surface, atmospheric radiation transfer, etc.
|
credits:
© The COMET Program
copyright terms:
COMET Standard Terms of Use
description:
Conceptual cross section showing parameterized processes
|
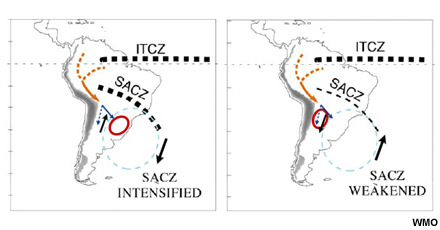
credits:
WMO
copyright terms:
COMET Standard Terms of Use
description:
Opposite phases of the dominant mode of variability over South America during the monsoon. Thick orange arrows are the low-level jets. The red circle is where mesoscale convection will be enhanced.
|
credits:
© The COMET Program
copyright terms:
COMET Standard Terms of Use
description:
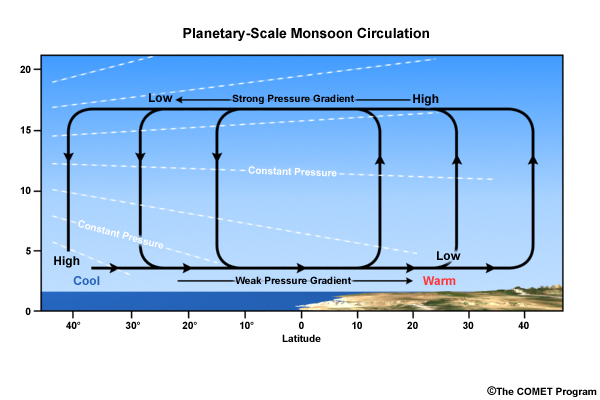
Schematic of planetary-scale monsoon circulations driven by differential heating between warm land and cool ocean on a rotating planet. The upper panel shows a cross-section of the circulation between the ocean and the land.
|
credits:
The COMET Program
copyright terms:
COMET Standard Terms of Use
description:
Schematic of planetary-scale monsoon circulations driven by differential heating between warm land and cool ocean on a rotating planet. The upper panel shows a cross-section of the circulation between the ocean and the land.
|
credits:
© The COMET Program
copyright terms:
COMET Standard Terms of Use
description:
Equator to pole profile showing the mean positions of the subtropical and polar jet, ITCZ convection, and clouds along the polar front.
|
credits:
© The COMET Program
copyright terms:
COMET Standard Terms of Use
description:
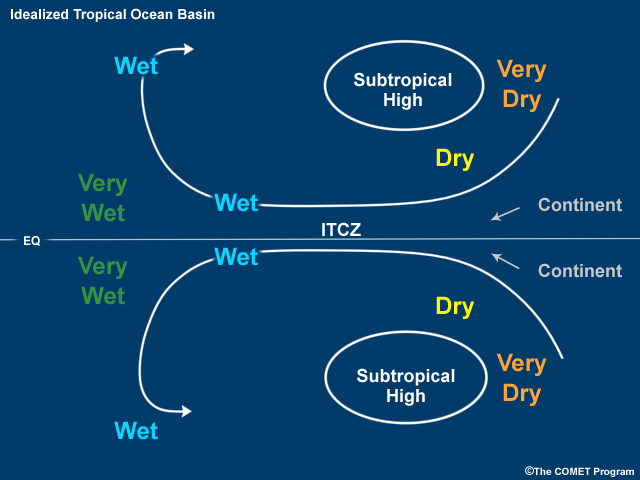
Idealized distribution of precipitation influenced by the subtropical highs, ITCZ and trade wind inversion.
|
credits:
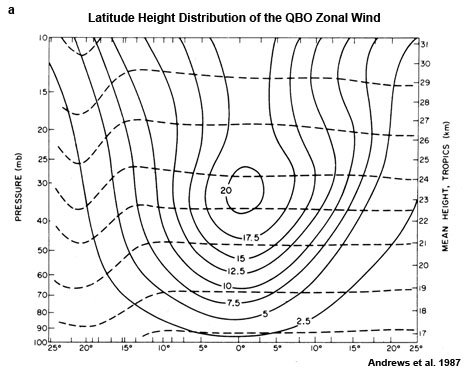
Andrews et al. 1987
copyright terms:
COMET Standard Terms of Use
description:
Latitude-height distribution of the amplitude and phase of the zonal wind QBO. Amplitude (solid lines) in m s -1, phase (dashed line) at 1- month intervals with time increasing downward (Andrews et al. 1987 ).
|
credits:
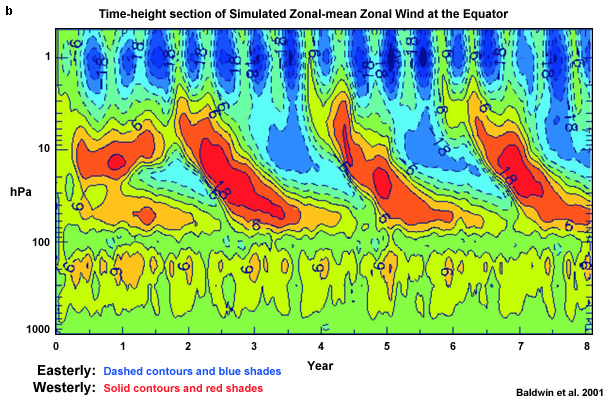
Baldwin et al. 2001
copyright terms:
COMET Standard Terms of Use
description:
Time-height cross-section of the equatorial zonal-mean zonal winds simulated by Takahashi. Westerly (red) and easterly (blue) winds have 6 m s-1 contour interval.
|
credits:
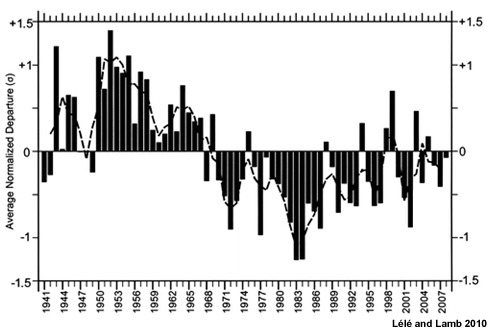
Lélé and Lamb 2010
copyright terms:
COMET Standard Terms of Use
description:
Time series (1941?2008) of average normalized April?October rainfall departure (σ) for 20 stations in the West African Sudan?Sahelian zone (11°?18°N) west of 10°E. From
|
credits:
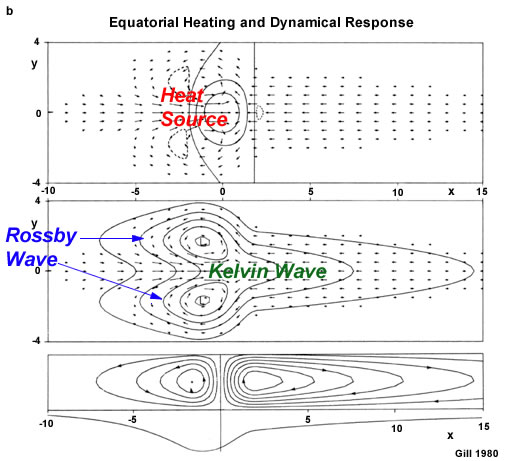
Gill 1980
copyright terms:
COMET Standard Terms of Use
description:
Other views of the circulations: horizontal wind vectors and vertical velocity contours; perturbation pressure contours overlaid on the same wind vectors; meridional integrated flow. The Rossby waves propagated westward and the Kelvin wave propagates eastward.
|
credits:
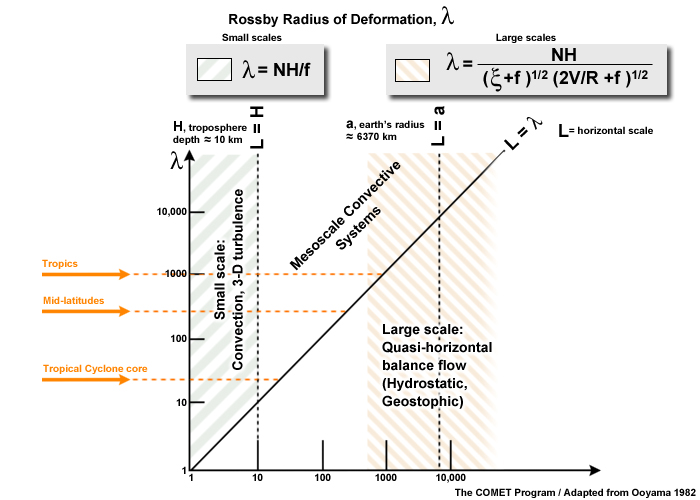
The COMET Program / Adapted from Ooyama 1992
copyright terms:
COMET Standard Terms of Use
description:
Scaling of the Rossby radius of deformation.
|
credits:
WMO
copyright terms:
COMET Standard Terms of Use
description:
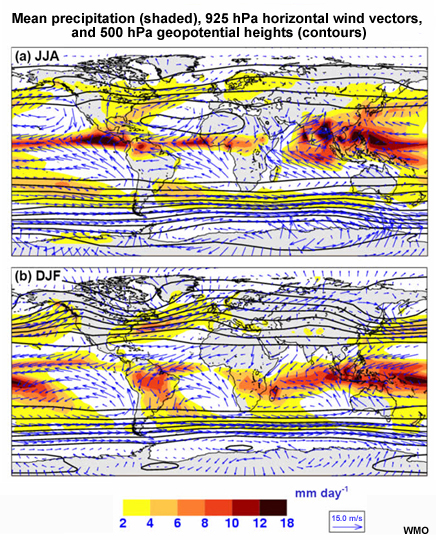
Seasonal mean precipitation (shaded, 925 hPa horizontal wind vectors, and 500 hPa geopotential heights (contoured every 10 dam) for (a) Jun-Aug and (b) Dec-Feb. Precipitation data from Xie and Arkin (1997) for the period 1979-1999; wind and geopotential height data from ERA-40 for the period 1962-2001.
|
credits:
The COMET Program/NCAR/NOAA NGDC
copyright terms:
COMET Standard Terms of Use
description:
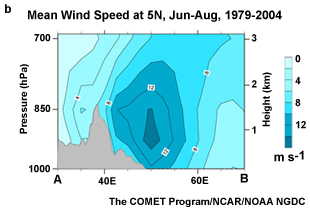
Cross section along 5°N showing the magnitude and areal extent of the Somali jet core (data from the Japanese 25-year Reanalysis, 1979-2004).
|
credits:
NOAA/NCEP/CPC
copyright terms:
COMET Standard Terms of Use
description:
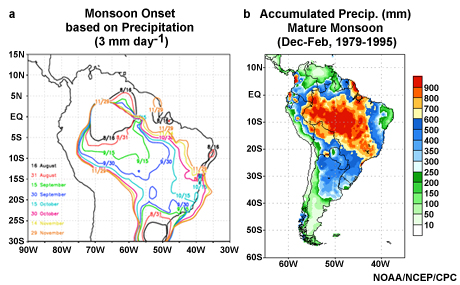
(left) Mean South American Monsoon onset date based on occurrence of 3 mm/day of rainfall and (right) the accumulated gauge precipitation (mm) for the mature monsoon (December - February, 1979-1995)
|
credits:
©The COMET Program
copyright terms:
COMET Standard Terms of Use
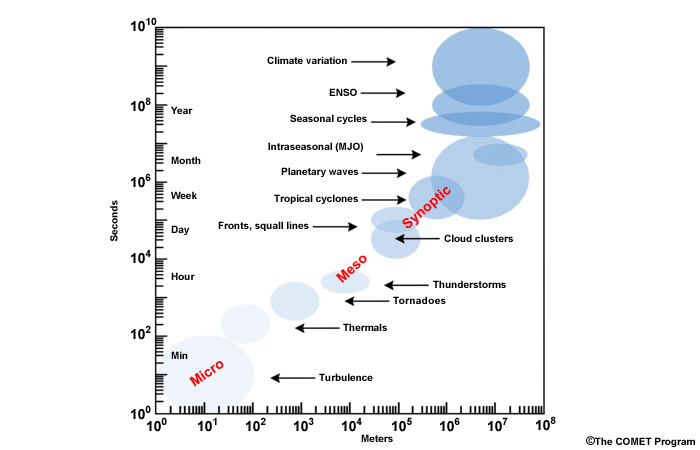
description:
Space and time scales of dynamical processes in the atmosphere
|
credits:
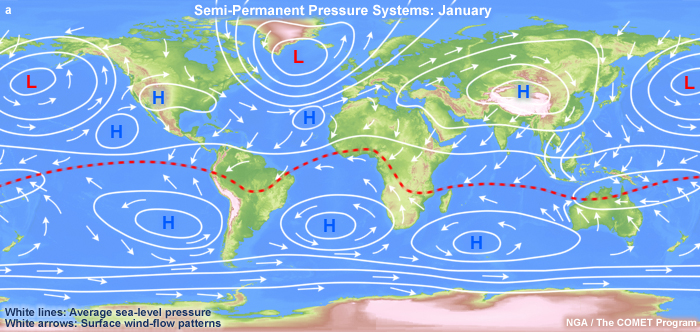
NGA / The COMET Program
copyright terms:
COMET Standard Terms of Use
description:
World map marked with ocean currents and winds moving around semi-permanent high-pressure cells typical for the month of January
|
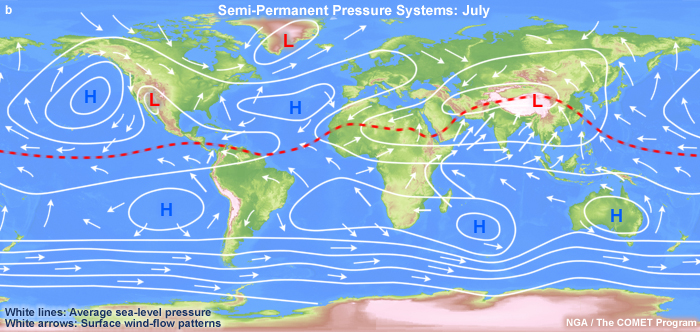
credits:
NGA / The COMET Program
copyright terms:
COMET Standard Terms of Use
description:
World map marked with ocean currents and winds moving around semi-permanent high-pressure cells typical for the month of July.
|
credits:
© The COMET Program
copyright terms:
COMET Standard Terms of Use
description:
Static image from a frame of an animation of air moving upward and poleward in the Hadley cell to form the Subtropical Jet; air moving poleward from the equator to a smaller radius of rotation speeds up to conserve angular momentum.
|
view/save .swf file
credits:
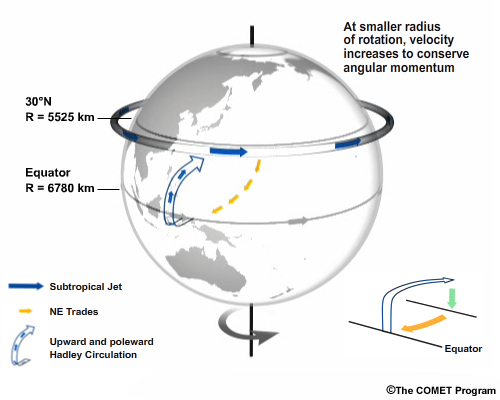
© The COMET Program
copyright terms:
COMET Standard Terms of Use
description:
Schematic of air moving upward and poleward in the Hadley cell to form the Subtropical Jet; air moving poleward from the equator to a smaller radius of rotation speeds up to conserve angular momentum.
|
credits:
Meehl et al. 2003
copyright terms:
COMET Standard Terms of Use
description:
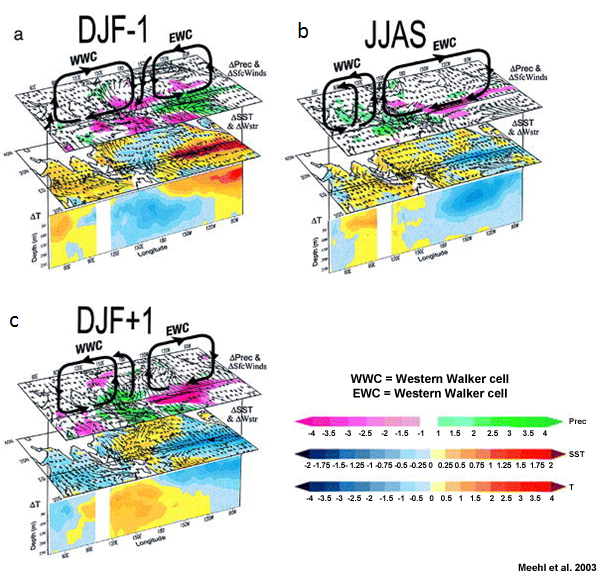
Time sequence of TBO evolution showing positive minus negative TBO composites for equatorial upper-ocean temperature differences (blue-red, °C), SST (blue-red, °C), surface wind stress (scaling arrow = 0.03 N m−2), precipitation (pink-green, mm day−1), surface winds (scaling arrow = 1.0 m s−1), and schematic representation of large-scale Walker circulation anomalies for (a) DJF − 1 showing the weak Australian monsoon prior to a strong Indian monsoon, (c) strong Indian monsoon season during JJAS, (e) strong Australian monsoon following a strong Indian monsoon. Contour interval for precipitation is 0.5 mm day−1 (values between −1 and +1 mm day−1 are not plotted), for SST is 0.25°C, and for upper-ocean temperature is 0.5°C. Notice the opposite anomaly phases during the DJF-1 and DJF+1. (Meehl et al. 2003).
|
credits:
USGODAE/The COMET Program
copyright terms:
COMET Standard Terms of Use
description:
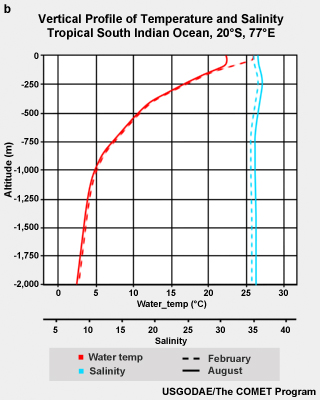
Schematic of dynamic and thermodynamic processes in the upper ocean. Monthly mean temperature (red line) and salinity (magenta line) profile during summer and winter in the tropical south Indian Ocean.
|
credits:
NOAA/ESRL (upper panel), Adapted from Uccellini and Kocin 1987/ The COMET Program
copyright terms:
COMET Standard Terms of Use
description:
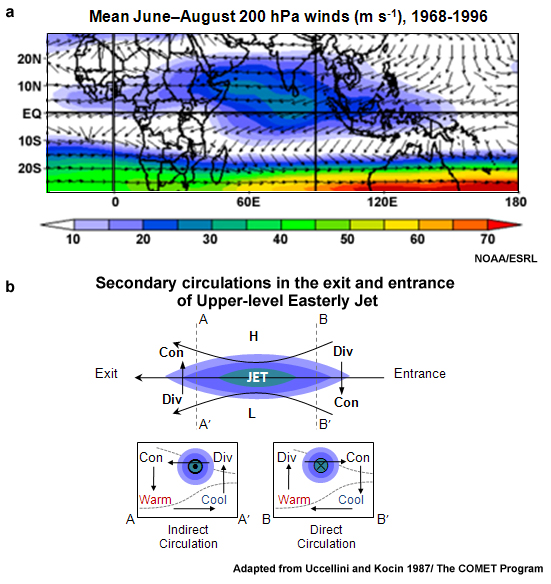
Mean wind vectors at 200 hPa (1948-2000). Color shades mark the TEJ and the schematic shows the ageostrophic motion and regions of expected upper-level divergence (rising motion) and convergence (subsidence).
|
credits:
SPARC, drawn by D. Pendlebury
copyright terms:
COMET Standard Terms of Use
description:
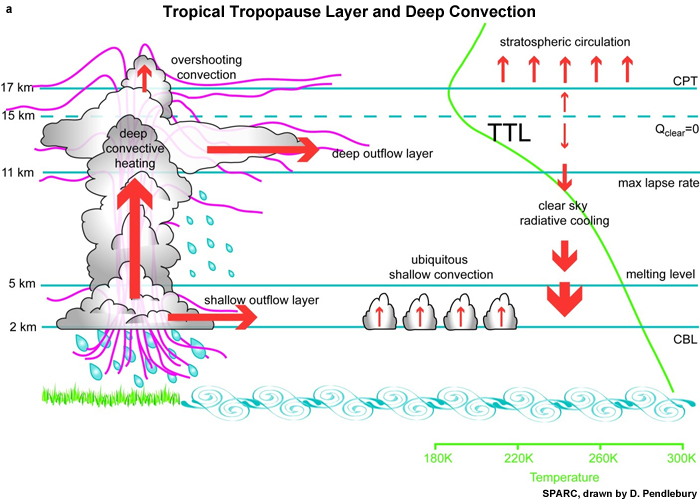
Schematic of the TTL, convection, and vertical transport in the tropics, the mean temperature profile where CPT is the cold point tropopause.
|
credits:
© The COMET Program
copyright terms:
COMET Standard Terms of Use
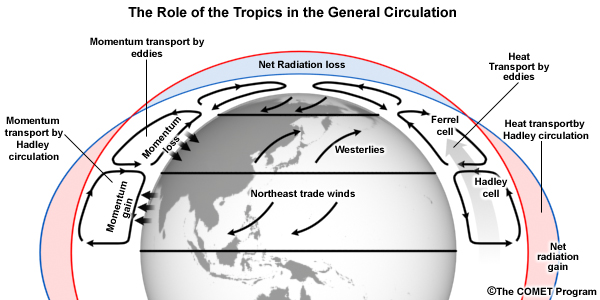
description:
The role of the Tropics in the General Circulation
|
credits:
UCAR
copyright terms:
COMET Standard Terms of Use
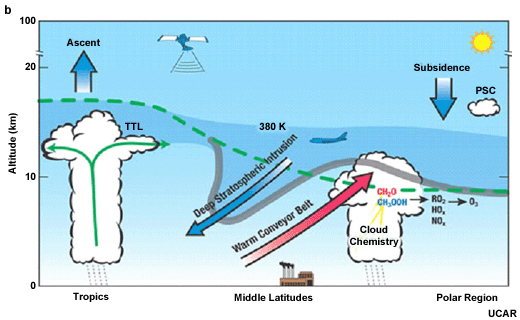
description:
Important processes coupling dynamics, chemistry and cloud microphysics in the upper troposphere and lower stratosphere. The dashed green line denotes the time average tropopause. Deep blue shading marks the TTL. Green arrows represent transport of near-surface pollutants into the upper troposphere, strongly influencing global-scale chemistry. Adapted from Stohl et al. (2003)
|
credits:
© The COMET Program
copyright terms:
COMET Standard Terms of Use
description:
Tropical circulations that result from (a) anti-symmetric and (b) symmetric components of diabatic heating.
|
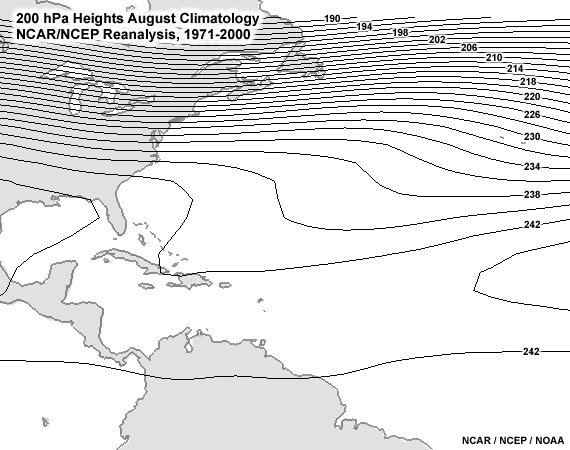
credits:
NCAR / NCEP / NOAA
copyright terms:
COMET Standard Terms of Use
description:
Mean 200 hPa heights for August 1971-2000 (from NCEP/NCAR Reanalysis). A blue, dashed line marks the TUTT.
|
|
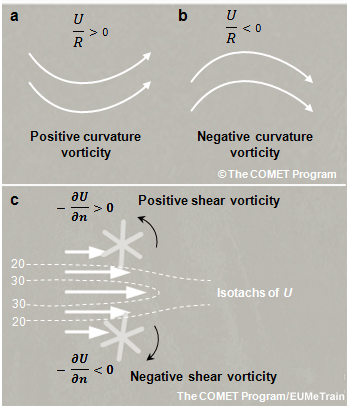
credits:
The COMET Program/EUMeTrain
copyright terms:
COMET Standard Terms of Use
description:
(a,b) Streamline patterns for curvature vorticity. (c) Flow with linear shear that produces positive and negative shear vorticity. The paddle wheels and curved arrows in (c) show the relative turning produced by the linear wind shear.
|
credits:
Loschnigg et al. 2003
copyright terms:
COMET Standard Terms of Use
description:
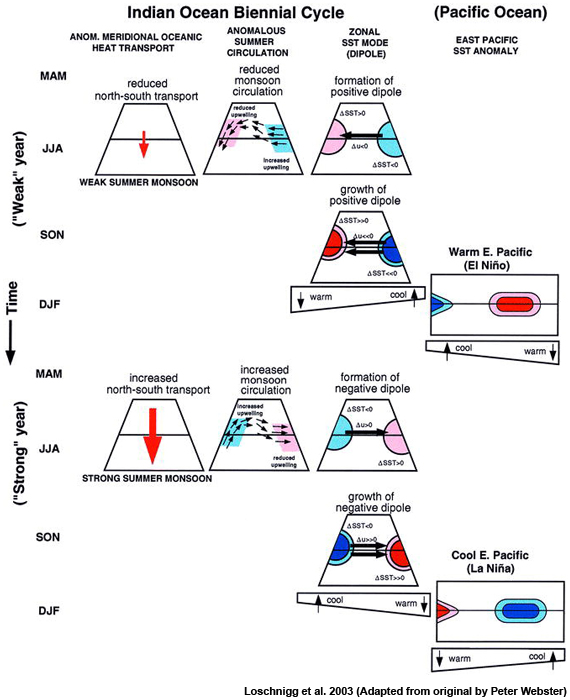
Schematic of the feedback between Indian and Pacific oceans and the Asian monsoon during the evolution from weak (dry) to strong (moist) monsoons
|
credits:
Lélé and Lamb 2010
copyright terms:
COMET Standard Terms of Use
description:
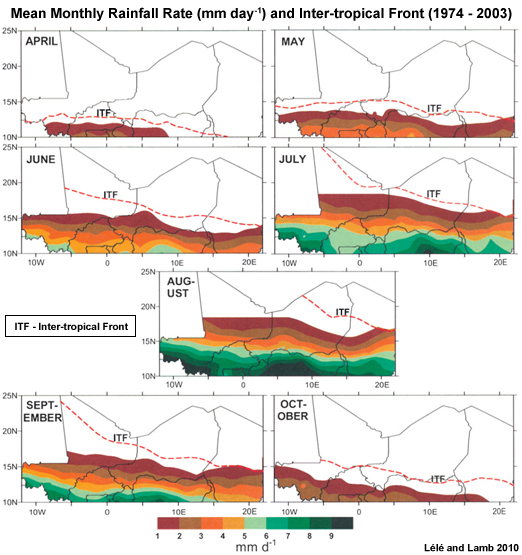
Long-term (1974?2003) average calendar monthly rainfall rate isohyets (mm day-1) in relation to the long-term average (1974?2003) monthly ITF position (red broken line) for April?October in the West African Sudan?Sahel zone.
|
credits:
The COMET Program/NASA
copyright terms:
COMET Standard Terms of Use
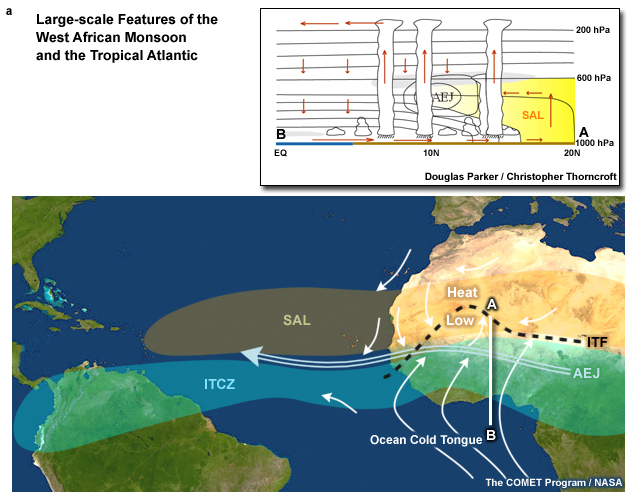
description:
(a) Major large-scale features and (b) key synoptic and mesoscale weather systems of the West Africa monsoon and the tropical Atlantic. (c) Schematic of N-S vertical cross section along the Greenwich Meridian highlighting the heat low-AEJ-ITCZ system, the SAL
|
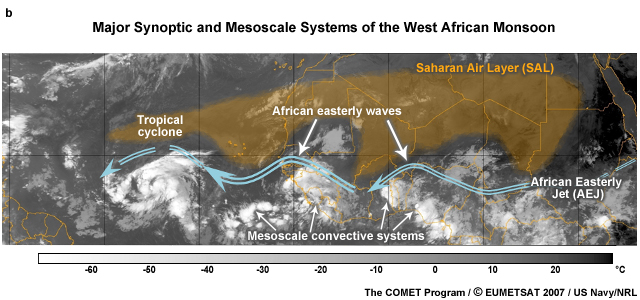
credits:
THe COMET Program /(c) EUMETSAT 2007 / US Navy/NRL
copyright terms:
COMET Standard Terms of Use
description:
Major synoptic and mesoscale weather systems of the West Africa monsoon and the tropical Atlantic.
|
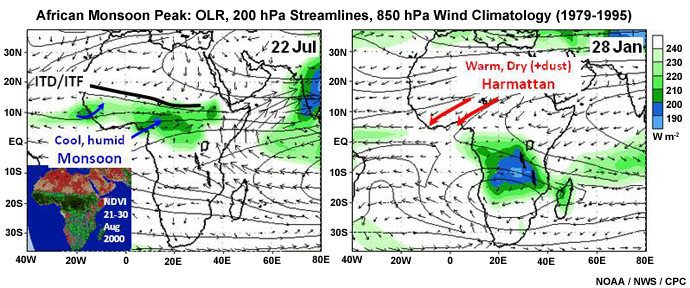
credits:
NOAA / NWS
copyright terms:
COMET Standard Terms of Use
description:
OLR (shaded), 200 hPa streamlines, and 850 hPa wind vectors. Thick, black line marks the Intertropical Discontinuity (ITD) or Intertropical Front (ITF). The inset map shows the Normalized Difference Vegetation Index (NDVI) for 21-31 August 2000.
|
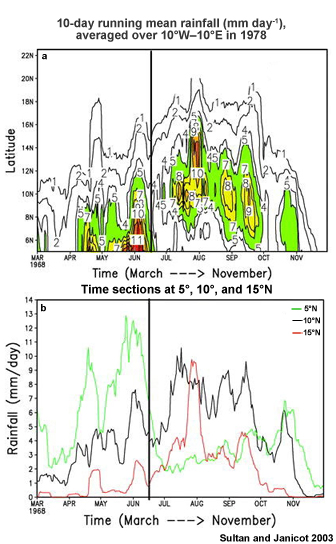
credits:
Sultan and Janicot 2003
copyright terms:
COMET Standard Terms of Use
description:
Seasonal evolution of rainfall in 1978 based on daily rainfall observations between 10°W-10°E.
|
credits:
© The COMET Program
copyright terms:
COMET Standard Terms of Use
description:
Mean annual cycle of surface pressure over India (20N) and south Indian Ocean (20S).
|
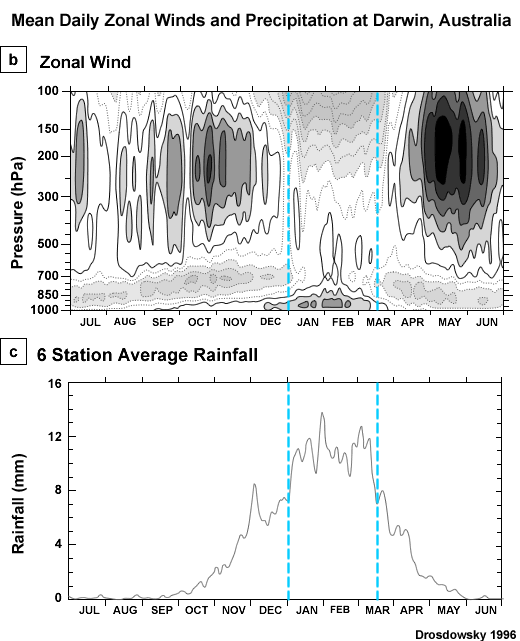
credits:
Drosdowsky 1996
copyright terms:
COMET Standard Terms of Use
description:
Mean daily zonal winds and precipitation at Darwin, Australia.
|